Pivotal Container Service (PKS)でPrometheus Operatorを使うメモ
PKSでPrometheus Operatorを使うメモです。
普通にPrometheusをデプロイするmanifestを書くのではなくPrometheus Operatorを使う理由は
- ConfigMapまたはSecretで
prometheus.ymlをざっくり管理するのではなく、Custom Resource Definition(CRD)でKuberntes NativeなPrometheusのConfigurationができる。 - kube-prometheusでOpinionatedなPrometheus/AlertManager/Grafanaをインストールできる。
個人手にHelm Chartは嫌いなので検討対象外です。 CRDを使うことには少し抵抗がありましたが、CRDはこれから一般的になっていくことが推測されるのと、 Prometheus OperatorはOperatorの代表例にもなっていますし野良CRDよりも信用できるので、Kubernetes Nativeなやり方に慣れてみることにしました。
PCFではPrometheusはBOSH Releaseを使ってインストールするのが一般的ですが、 この場合はモニタリングはk8sの外から行うことになります。個人的にはモニタリングは外から行うべきだと思いますが、Servivce Discoveryを使ってコンテナにアクセスしてscrapeするにはPrometheusをk8sの中に配置する必要があります。そのため、
- VMレベルのモニタリング(BOSH Exporter, Node Exporter) => Prometheus BOSH Release
- コンテナ/アプリレベルのモニタリング => Prometheus Operator
で使い分けます。BOSH Exporterのインストール方法はこちらを参照してください。
PKS側の設定
Prometheus Operatorが用意するmanifestはsecurityContent.runAsUserが設定されています。本稿執筆時点でのPKS最新バージョンである1.2が内包するCloud Foundry Container Runtime(CFCR, formerly known as Kubo) 0.21.0ではPrivileged Containersを無効(デフォルト、推奨)にすると、SecurityContextDenyが設定されてしまうため、Prometheus Operatorのmanifestを変更せずに使うには不本意ながら"Enable Privileged Containers - Use with caution"にチェックを入れてインストールする必要があります。

この制約はCFCR 0.22.0で修正されたため、おそらくPKS 1.3では修正されると思います。
Kubernetesクラスタの作成
PKSはインストールされている前提です。Privileged Containersが有効になっているplanで普通にクラスタを作成してください。
pks create-cluster demo -e demo.pks.bosh.tokyo -p small -u admin
しばらくするとクラスタができます。(PKS 1.2では30分くらいかかります...我慢)
$ pks cluster demo

Name:                     demo
Plan Name:                small
UUID:                     ca28e2f6-1b90-4929-80cc-8949143c757b
Last Action:              CREATE
Last Action State:        succeeded
Last Action Description:  Instance provisioning completed
Kubernetes Master Host:   demo.pks.bosh.tokyo
Kubernetes Master Port:   8443
Worker Nodes:             1
Kubernetes Master IP(s):  10.0.8.4

$ pks get-credentials demo
Prometheus Operatorのインストール
本稿ではPrometheus Operator 0.24.0をインストールします。
git clone https://github.com/coreos/prometheus-operator.git
cd prometheus-operator
git checkout v0.24.0
contrib/kube-prometheus/manifests以下に含まれるmanifestを使って、CRDのインストールおよび、OpinionatedなPrometheus / AlertManager / Grafanaをインストールします。
このmanifestではNode Exporterもインストールされてしまうのですが、Node ExporterはBOSH addonとしてインストールした方が
- PKS管理の全k8sクラスタにまとめてインストールできる
- k8s以外のVM(PKS APIなど)のモニタリングもできる
- k8s自体がダウンしてもnode-exporterに影響がない
という点で良いのでここではインストール対象から除外します。(というか何らかの制約でインストールできません) Node Exporterのインストールは後述します。
for f in $(ls contrib/kube-prometheus/manifests/node-exporter-*);do
  mv $f $f.bak
done
これでkubectly applyでインストールします。デフォルトでPrometheusとAlertManagerが冗長な設定になっていますが、ここでは1 Podに減らします。
kubectl apply -f contrib/kube-prometheus/manifests/
kubectl patch -n monitoring alertmanager main --type='json' -p='[{"op": "replace", "path": "/spec/replicas", "value": 1 }]'
kubectl patch -n monitoring prometheus k8s --type='json' -p='[{"op": "replace", "path": "/spec/replicas", "value": 1 }]'
インストールできたらPod一覧は次のようになります。monitoring Namespaceに各種Podができていることを確認してください。
$ kubectl get pod  --all-namespaces
NAMESPACE     NAME                                    READY   STATUS    RESTARTS   AGE
kube-system   heapster-6d5f964dbd-kqnps               1/1     Running   0          28m
kube-system   kube-dns-6b697fcdbd-2tjhz               3/3     Running   0          29m
kube-system   kubernetes-dashboard-785584f46b-vxkgn   1/1     Running   0          28m
kube-system   metrics-server-5f68584c5b-lkx2w         1/1     Running   0          28m
kube-system   monitoring-influxdb-54759946d4-8rpn4    1/1     Running   0          28m
kube-system   telemetry-agent-b8957f99-wjsst          1/1     Running   0          22m
monitoring    alertmanager-main-0                     2/2     Running   0          12s
monitoring    grafana-566fcc7956-7fb8f                1/1     Running   0          3m
monitoring    kube-state-metrics-65bf5c56b6-2dbrk     4/4     Running   0          3m
monitoring    prometheus-k8s-0                        3/3     Running   1          2m
monitoring    prometheus-operator-6694d94d6b-7r2bw    1/1     Running   0          3m
pks-system    fluent-bit-m9pp8                        1/1     Running   0          28m
pks-system    sink-controller-578859d5f-7lfjd         1/1     Running   0          28m
Custom Resource Definition一覧も確認してください。
$ kubectl get crd
NAME                                    CREATED AT
alertmanagers.monitoring.coreos.com     2018-10-13T19:26:15Z
prometheuses.monitoring.coreos.com      2018-10-13T19:26:15Z
prometheusrules.monitoring.coreos.com   2018-10-13T19:26:16Z
servicemonitors.monitoring.coreos.com   2018-10-13T19:26:16Z
sinks.apps.pivotal.io                   2018-10-13T19:00:48Z
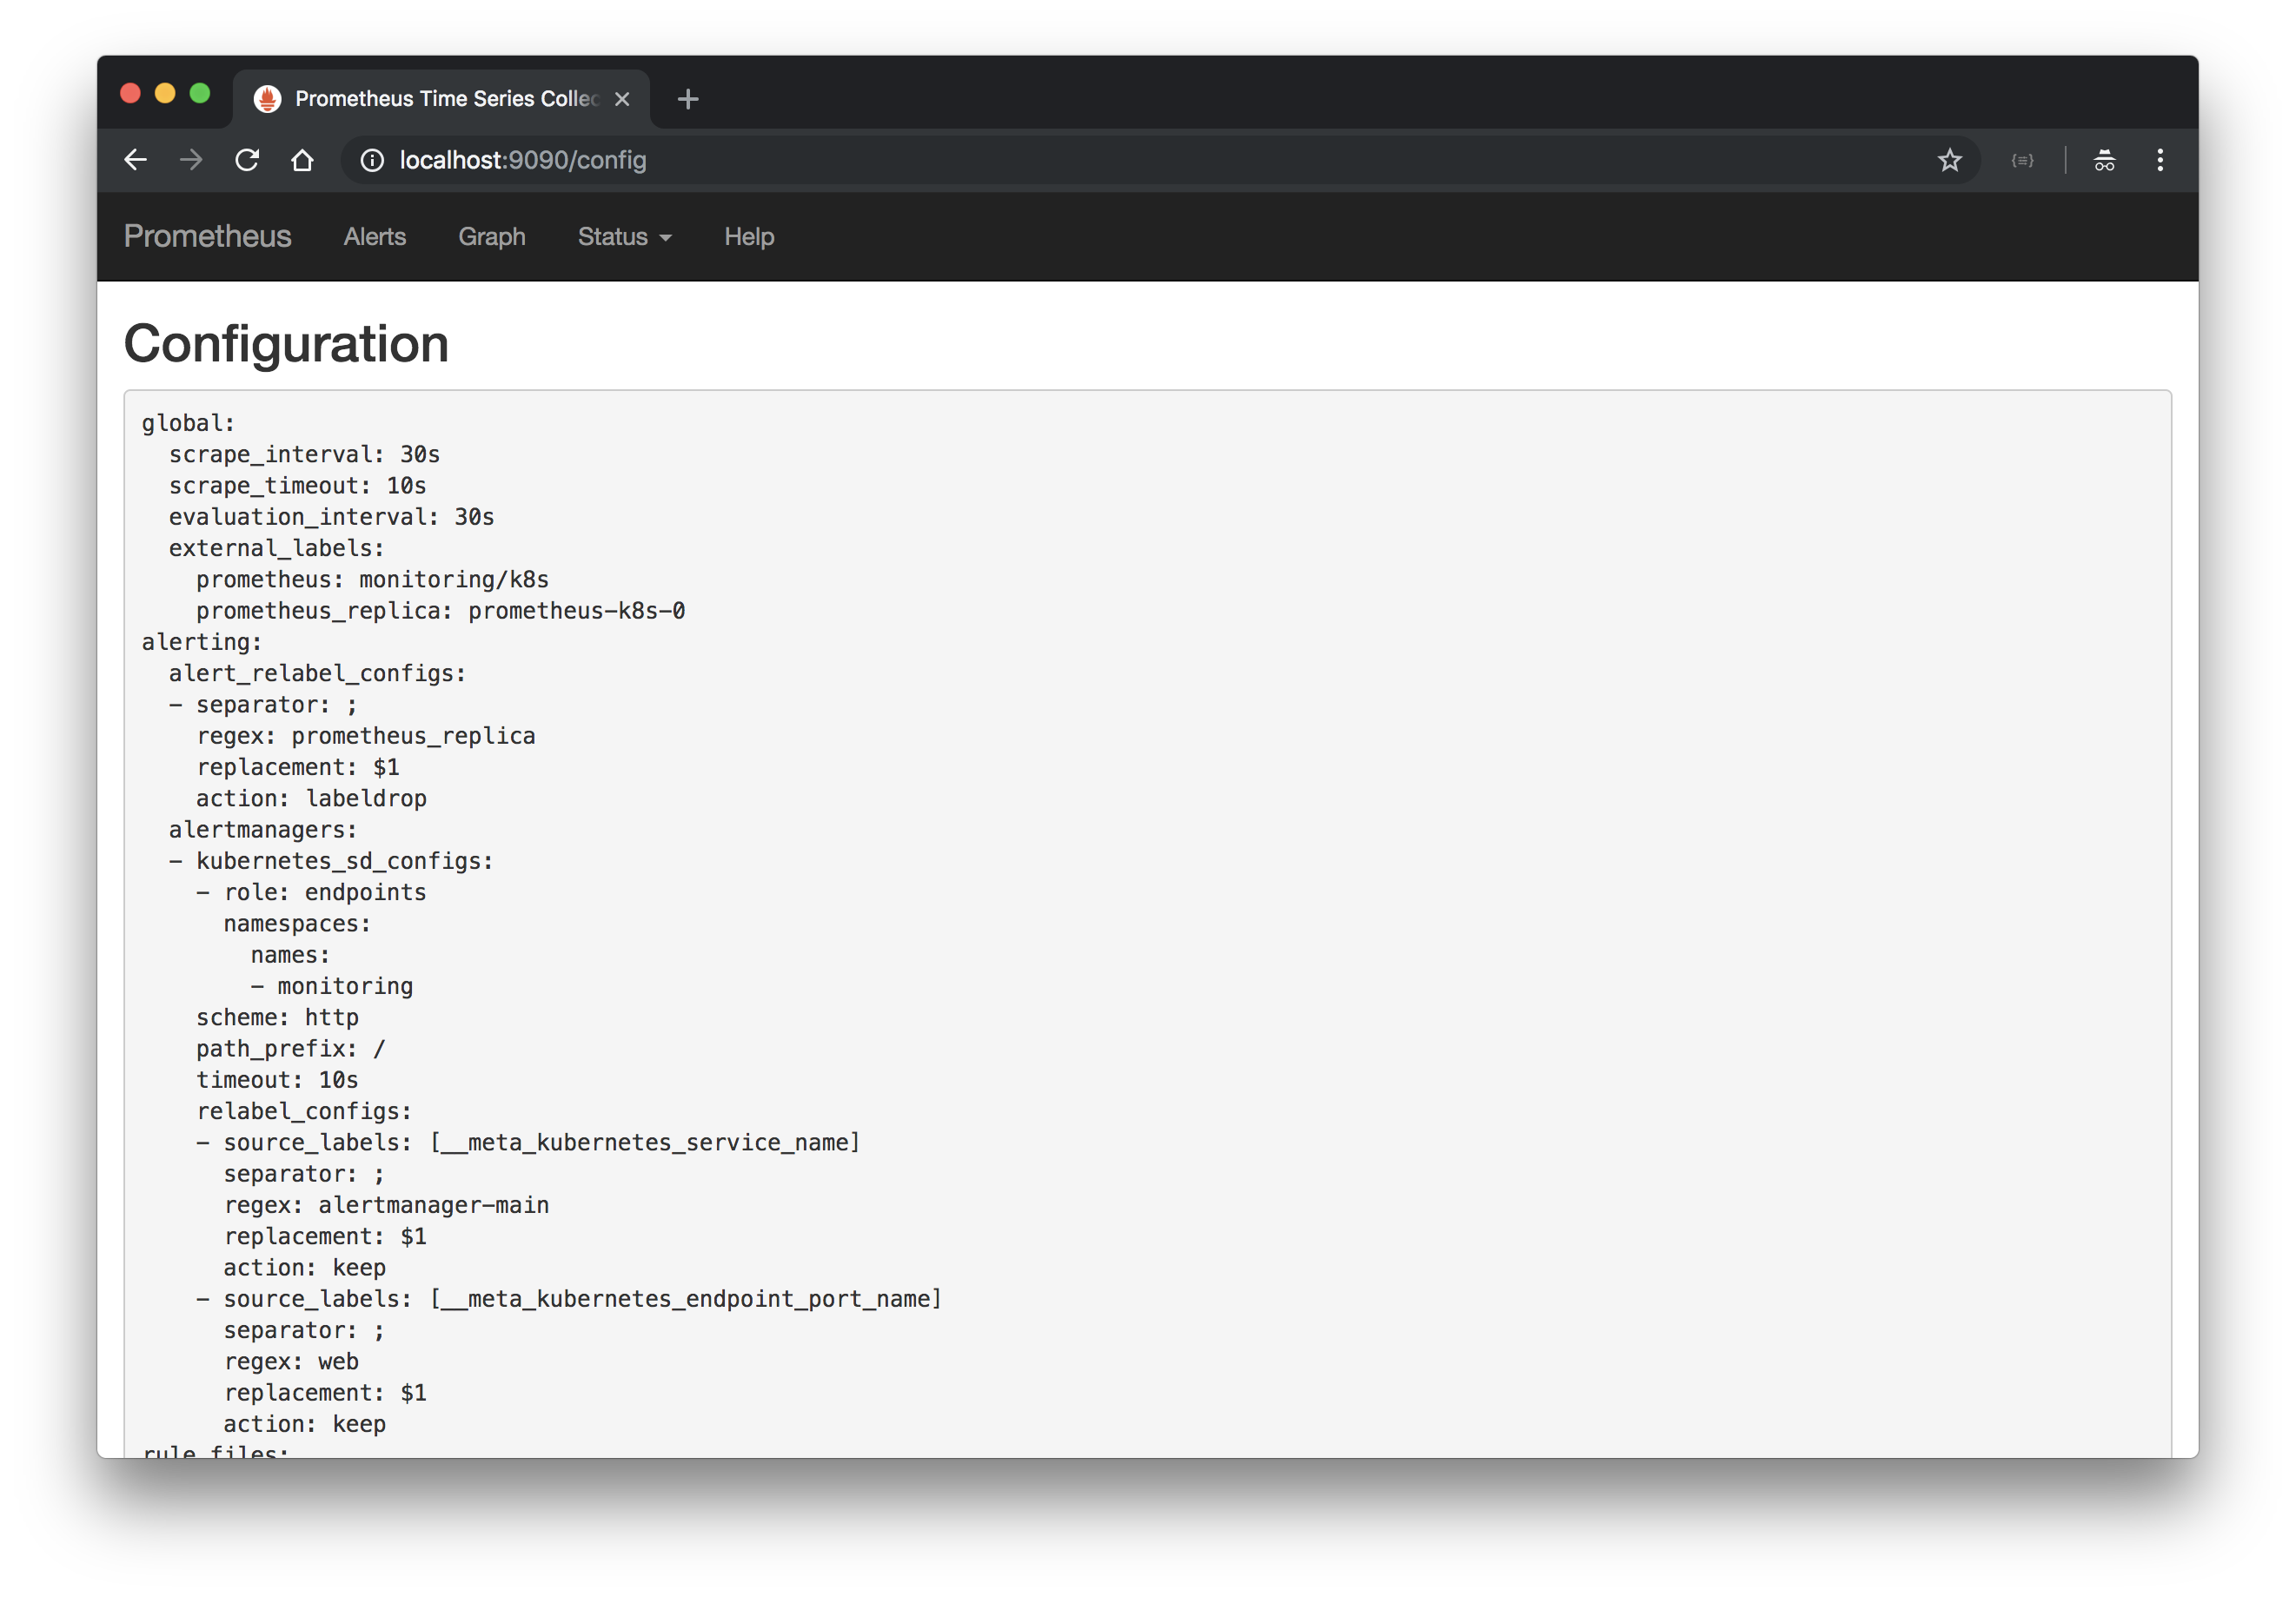
Prometheusにアクセスします。
kubectl port-forward -n monitoring $(kubectl get pod -n monitoring -l app=prometheus -o jsonpath='{.items[?(@.status.phase=="Running")].metadata.name}') 9090:9090

Configurationで複数のScrape Configが設定されていることを確認してください。
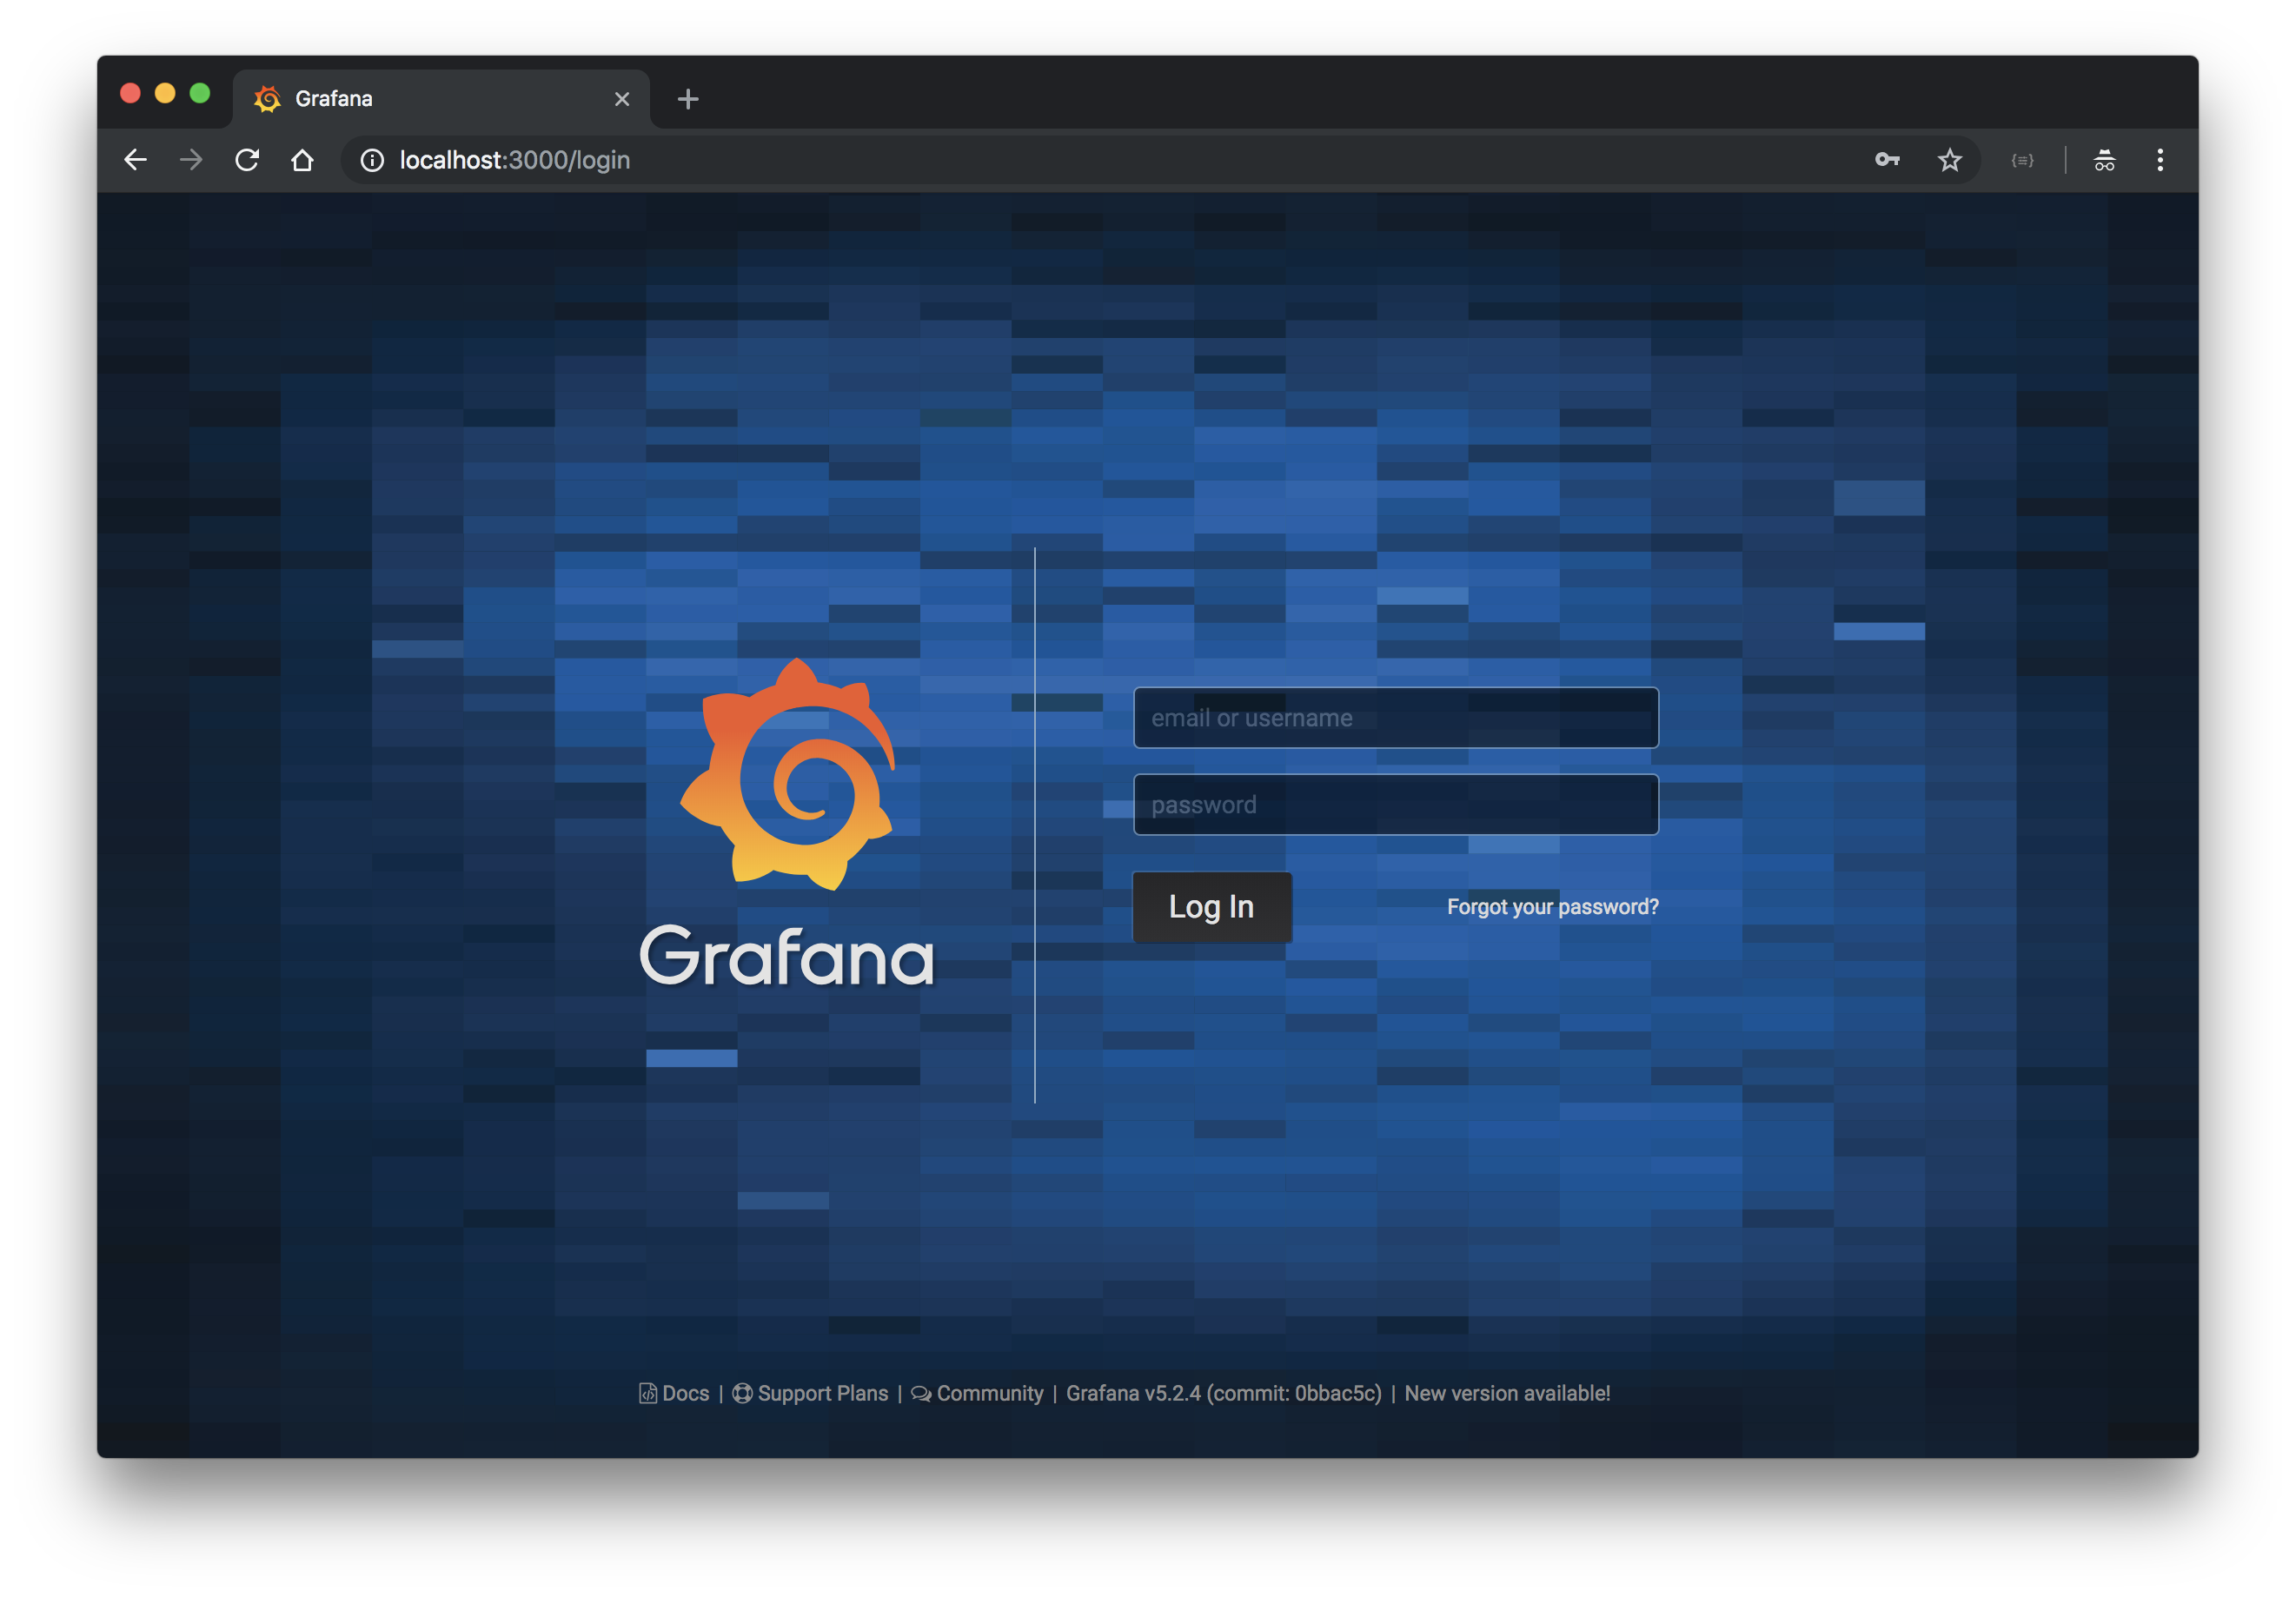
Grafanaにアクセスします。
kubectl port-forward -n monitoring $(kubectl get pod -n monitoring -l app=grafana -o jsonpath='{.items[?(@.status.phase=="Running")].metadata.name}') 3000:3000
admin/adminでログインしたのちパスワード変更を求められます。
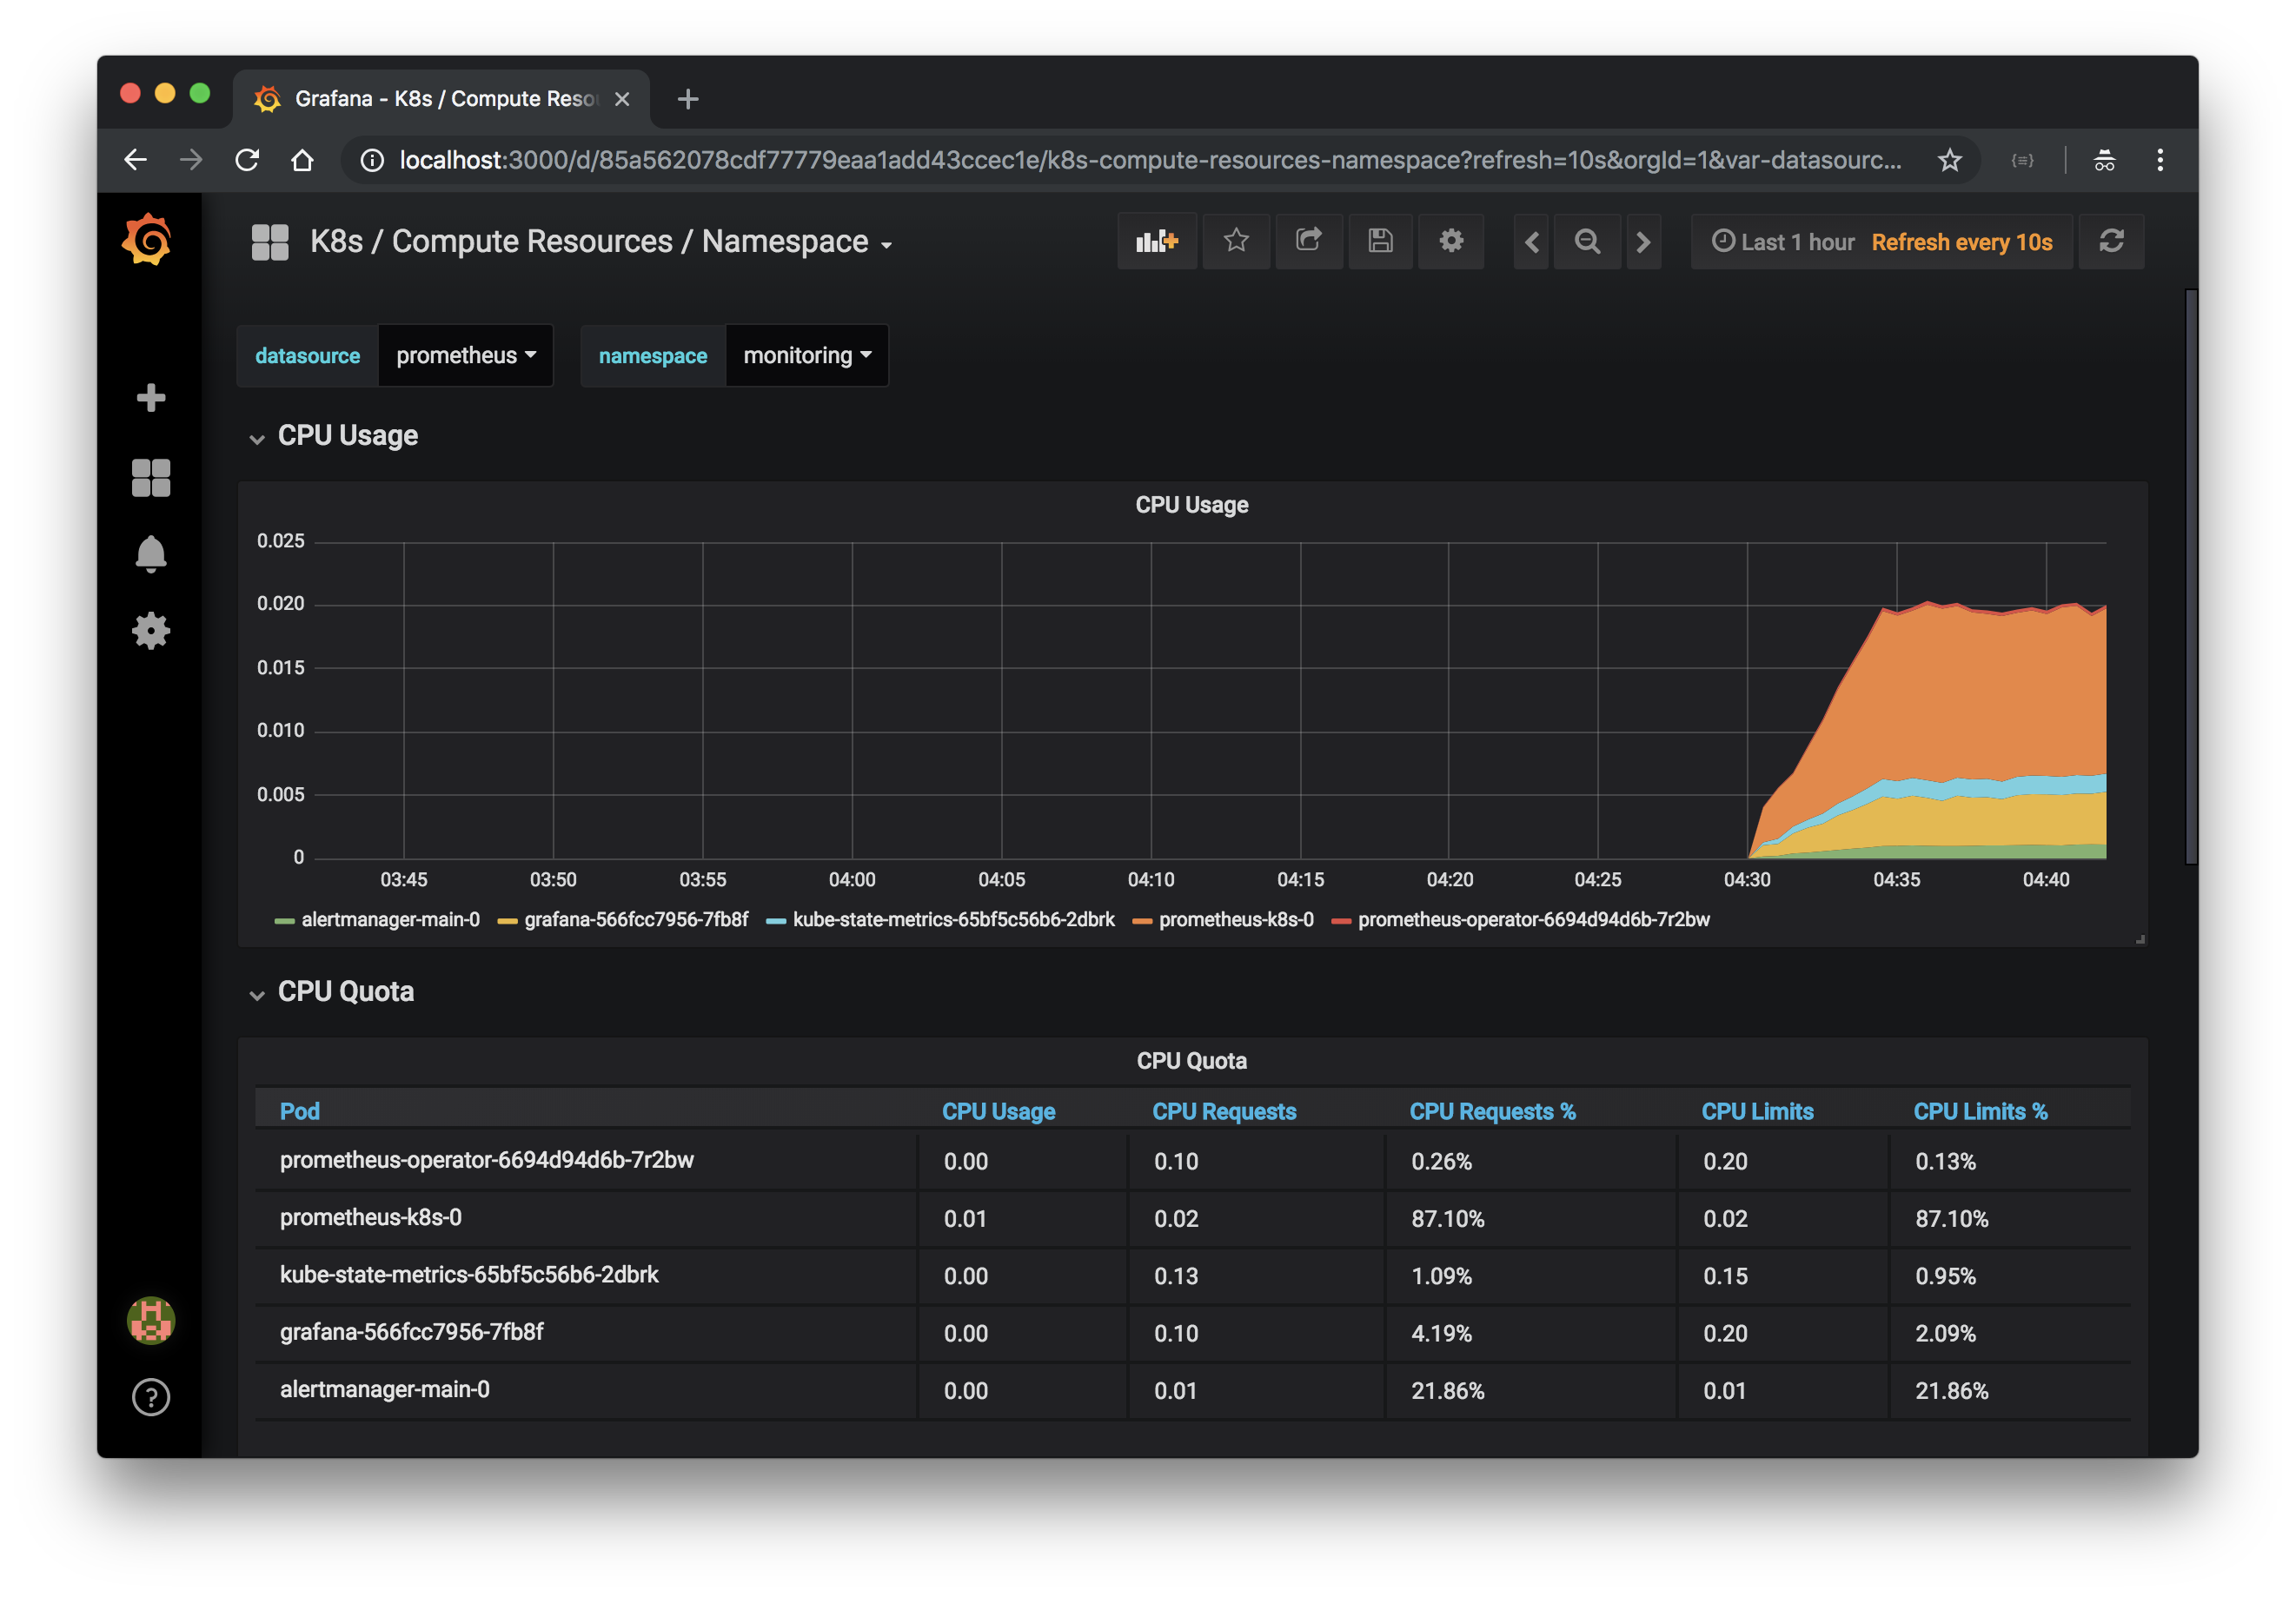
あらかじめDashboardが用意されています。

Namespace毎のメトリクス
Pod毎のメトリクス
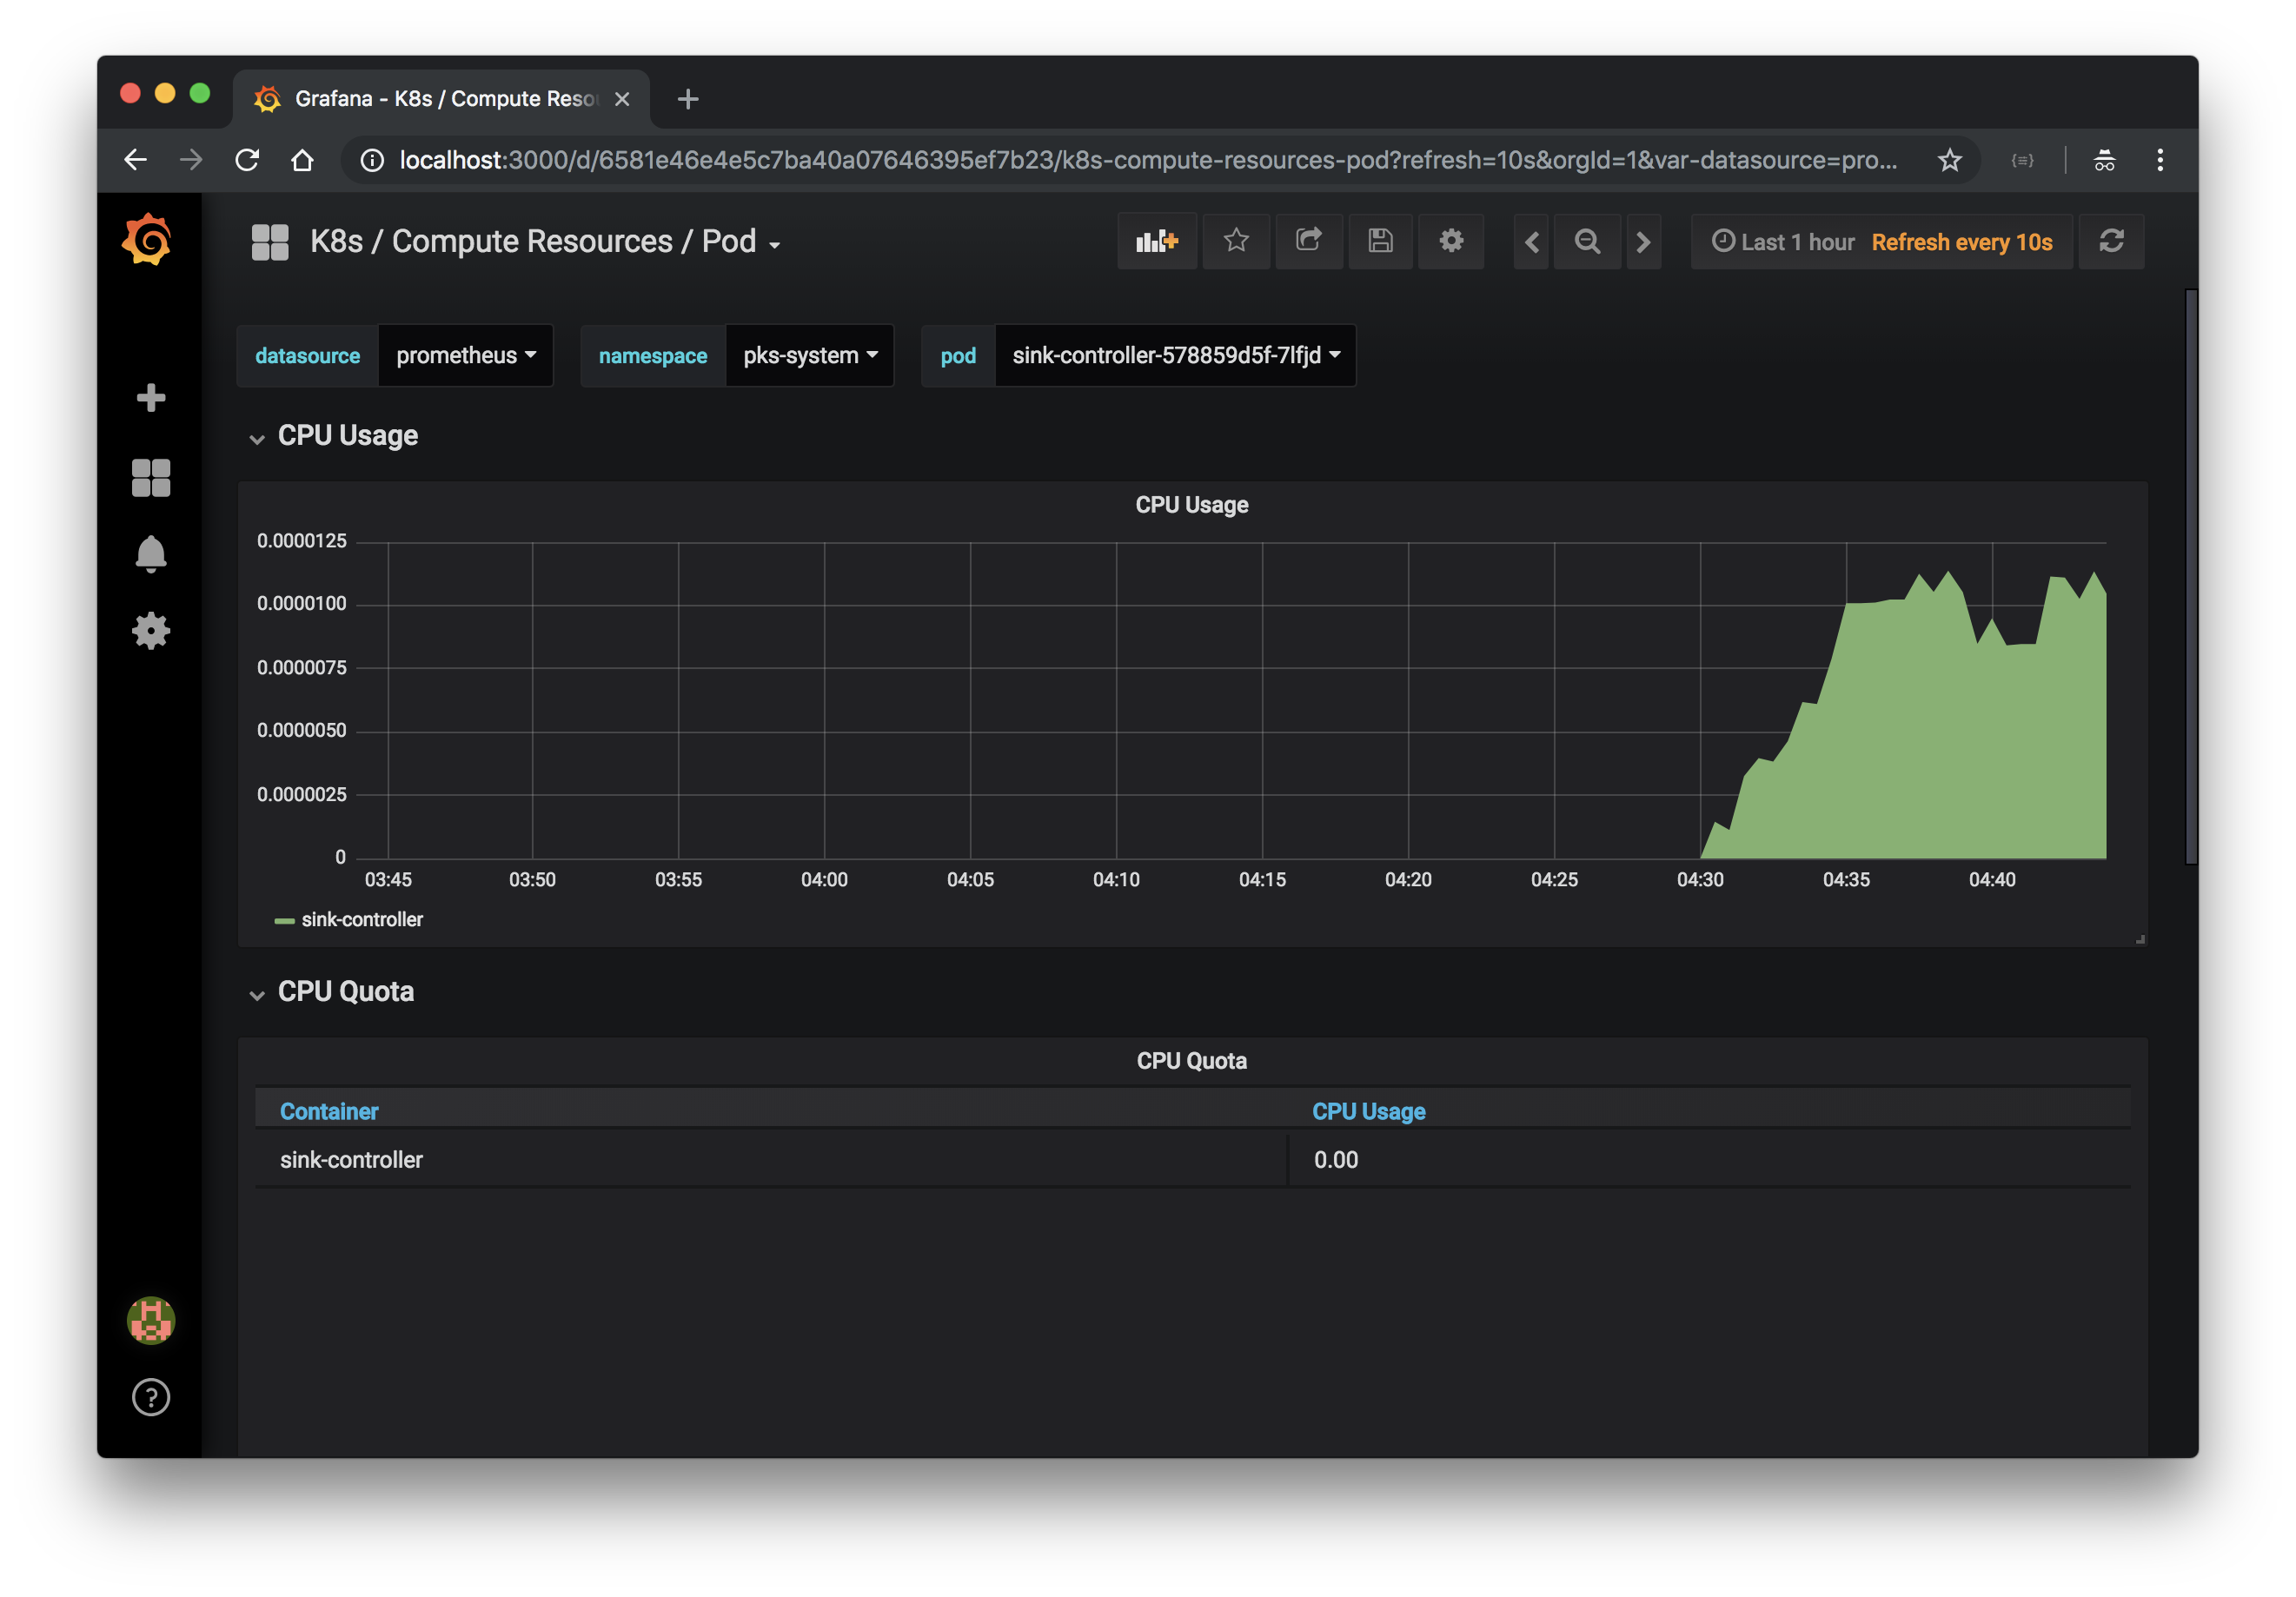
Node ExporterはインストールしていないのでNode毎のメトリクスやClusterのメトリクスは"No data points"となります。
TODO: Persistemt Volumeの設定がないので、Podが再作成されるとPrometheus, Grafana共にデータが消えます。Persistent Volumeの設定は後で書く。
Node Exporterのインストール
前述の通り、Node ExporterはBOSH addonとしてインストールします。
node-exporter.ymlに次の内容を記述してください。
releases:
- name: node-exporter
  version: 4.0.1
  url: https://github.com/bosh-prometheus/node-exporter-boshrelease/releases/download/v4.0.1/node-exporter-4.0.1.tgz
  sha1: 8f00d257838f33d5022d6c356c35d2922e75c9b4

addons:
- name: node-exporter
  jobs:
  - name: node_exporter
    release: node-exporter
    properties: {}
  include:
    stemcell:
    - os: ubuntu-trusty
    - os: ubuntu-xenial
次のコマンドでBOSH Runtime Configを設定してください。
bosh update-runtime-config --name=node-exporter node-exporter.yml
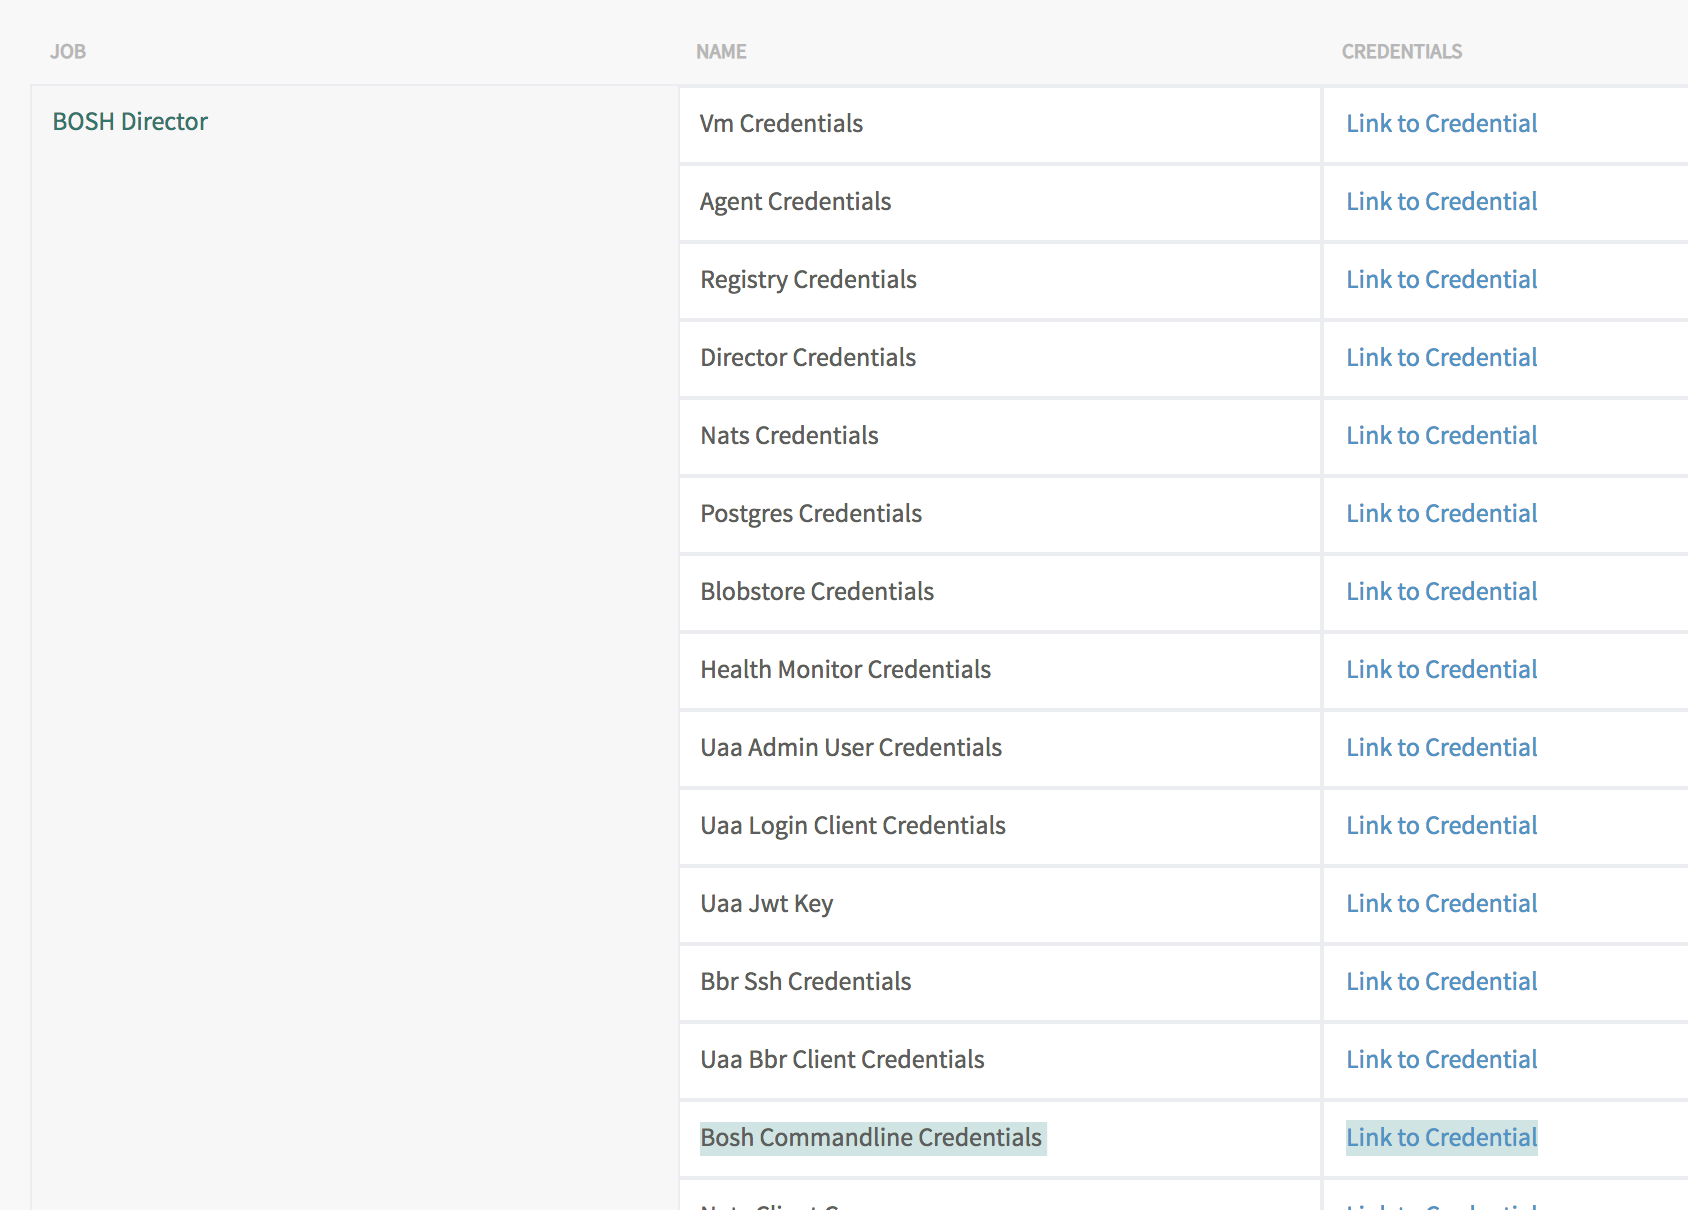
boshコマンドを使うにはOps ManagerのDirector TileのCredentialsから"BOSH Commandline Credentials"を参照し、次のように環境変数を設定してください。
export BOSH_CLIENT=ops_manager
export BOSH_CLIENT_SECRET=....
export BOSH_CA_CERT=/var/tempest/workspaces/default/root_ca_certificate
export BOSH_ENVIRONMENT=....
OpsManager VM上で作業するのが楽です。
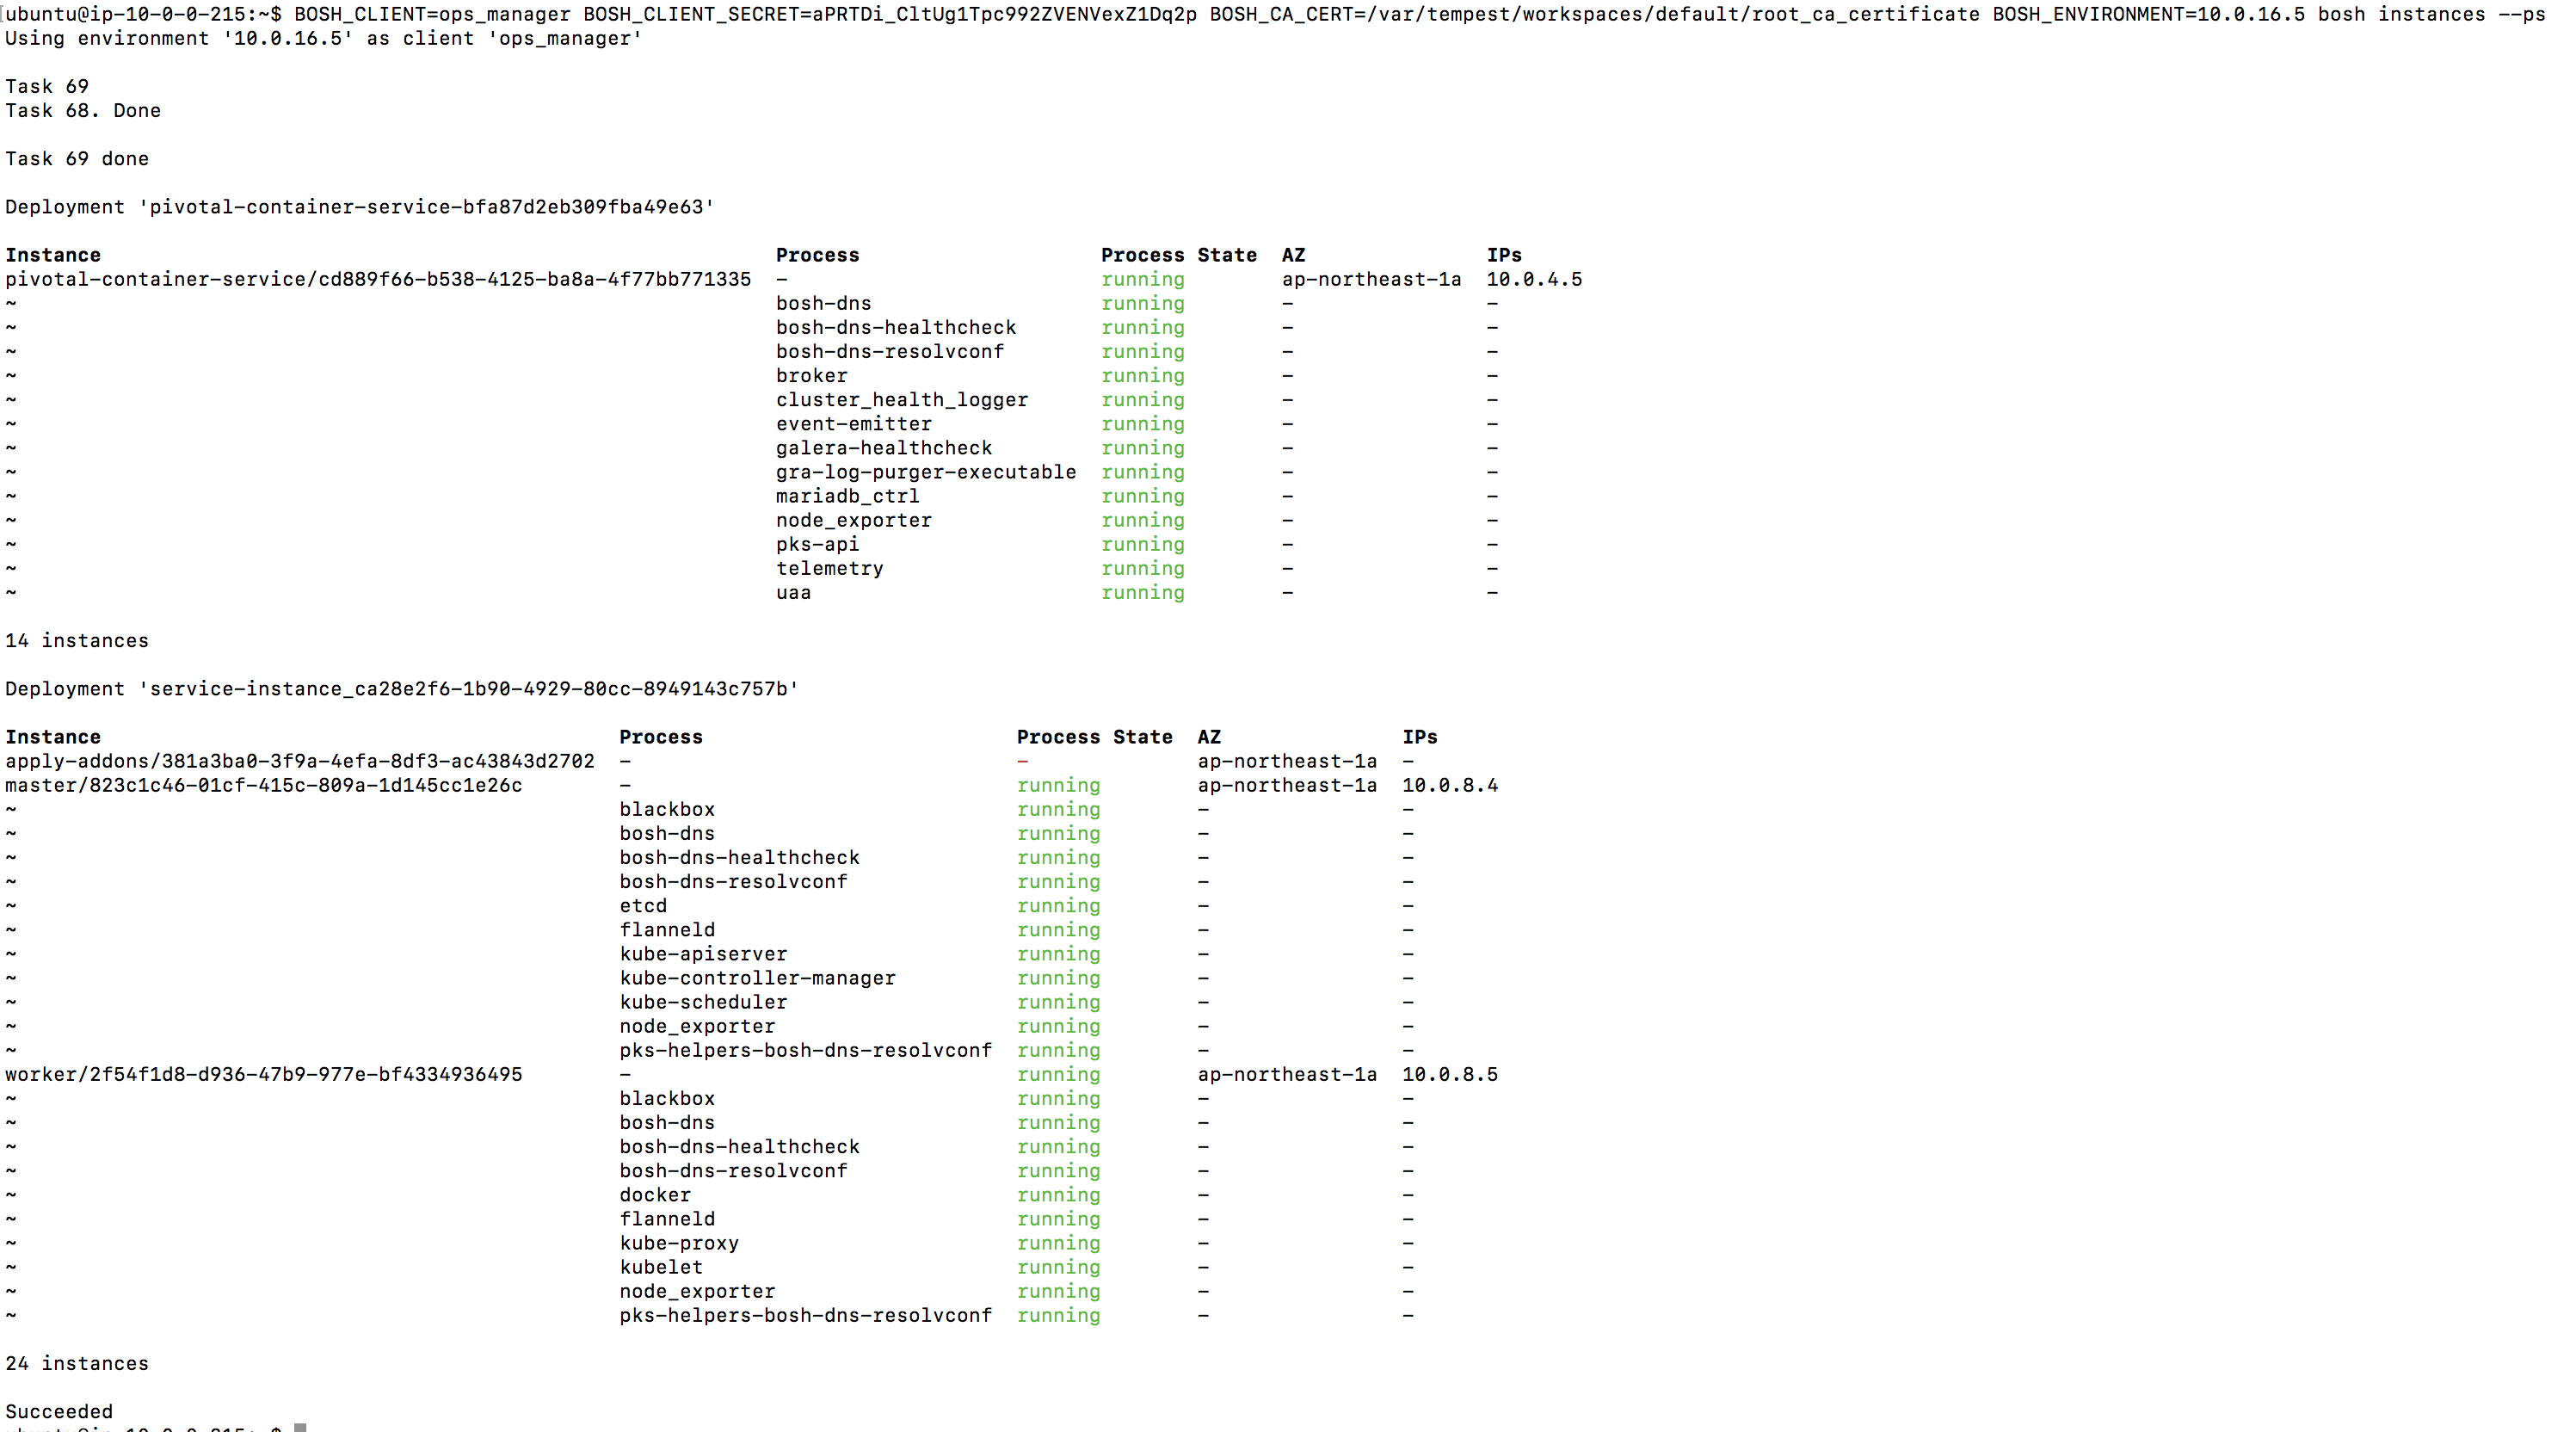
Runtime Configを設定したのち、OpsManagerで"Apply Changes"をクリックしてください。"Update All Clusters"のErrandを有効にするのを忘れないでください。 Apply Changesが終わったら次のコマンドで確認してください。
bosh instances --ps
各VM上にnode_exporterが起動していることがわかります。
次に、Kubernetes上のPrometheusにNode Exporter用のscrape configを設定します。 Node ExporterのモニタリングはBOSH側のPrometheusで行えますが、ここではPrometheus Operatorの使用例として説明します。
Prometheus Operatorで監視対象を追加するにはCRDに追加されたServiceMonitorリソースを定義しますが、Prometheus Operator管理外のExporterをscrapeする場合は、
これもCRDで追加されたPrometheusリソースのspec/additionalScrapeConfigsにscrape configをSecretリソース経由で渡します。
Node Exporter用のscrape configを作成するために、prometheus-additional.ymlに次の内容を記述してください。NodeのIPアドレスはKubernetes Service Discoveryで取得可能です。
- job_name: "node-exporter"
  kubernetes_sd_configs:
  - role: node
  bearer_token_file: /var/run/secrets/kubernetes.io/serviceaccount/token
  relabel_configs:
  - source_labels: [__meta_kubernetes_node_address_InternalIP]
    target_label: __address__
    regex: (.*)
    replacement: $1:9100
この設定ではKubernetesのWorker NodeしかMonitoringできません。その他のVMのモニタリングもしたい場合は
static_configsかfile_sd_configsを使用してください。
PrometheusがNodeの情報を取得できるようにするために、ClusterRoleを修正する必要があります。
kubectl patch clusterrole prometheus-k8s --type='json' -p='[{"op": "add", "path": "/rules/0/resources/-", "value": "nodes"}, {"op": "add", "path": "/rules/0/verbs/-", "value": "list"}, {"op": "add", "path": "/rules/0/verbs/-", "value": "watch"}]'
prometheus-additional.ymlをSecretとして作成します。
kubectl create -n monitoring secret generic additional-scrape-configs --from-file=prometheus-additional.yml --dry-run -oyaml > additional-scrape-configs.yml
kubectl apply -f additional-scrape-configs.yml
このSecretの情報をadditionalScrapeConfigsに設定します。
kubectl patch -n monitoring prometheus k8s --type='json' -p='[{"op": "add", "path": "/spec/additionalScrapeConfigs", "value": {"name": "additional-scrape-configs", "key": "prometheus-additional.yml"}}]'
PrometheusのPodを再作成して設定を反映させる必要があります。ここでは雑にPodを一旦Deleteします。
kubectl delete pod -n monitoring prometheus-k8s-0
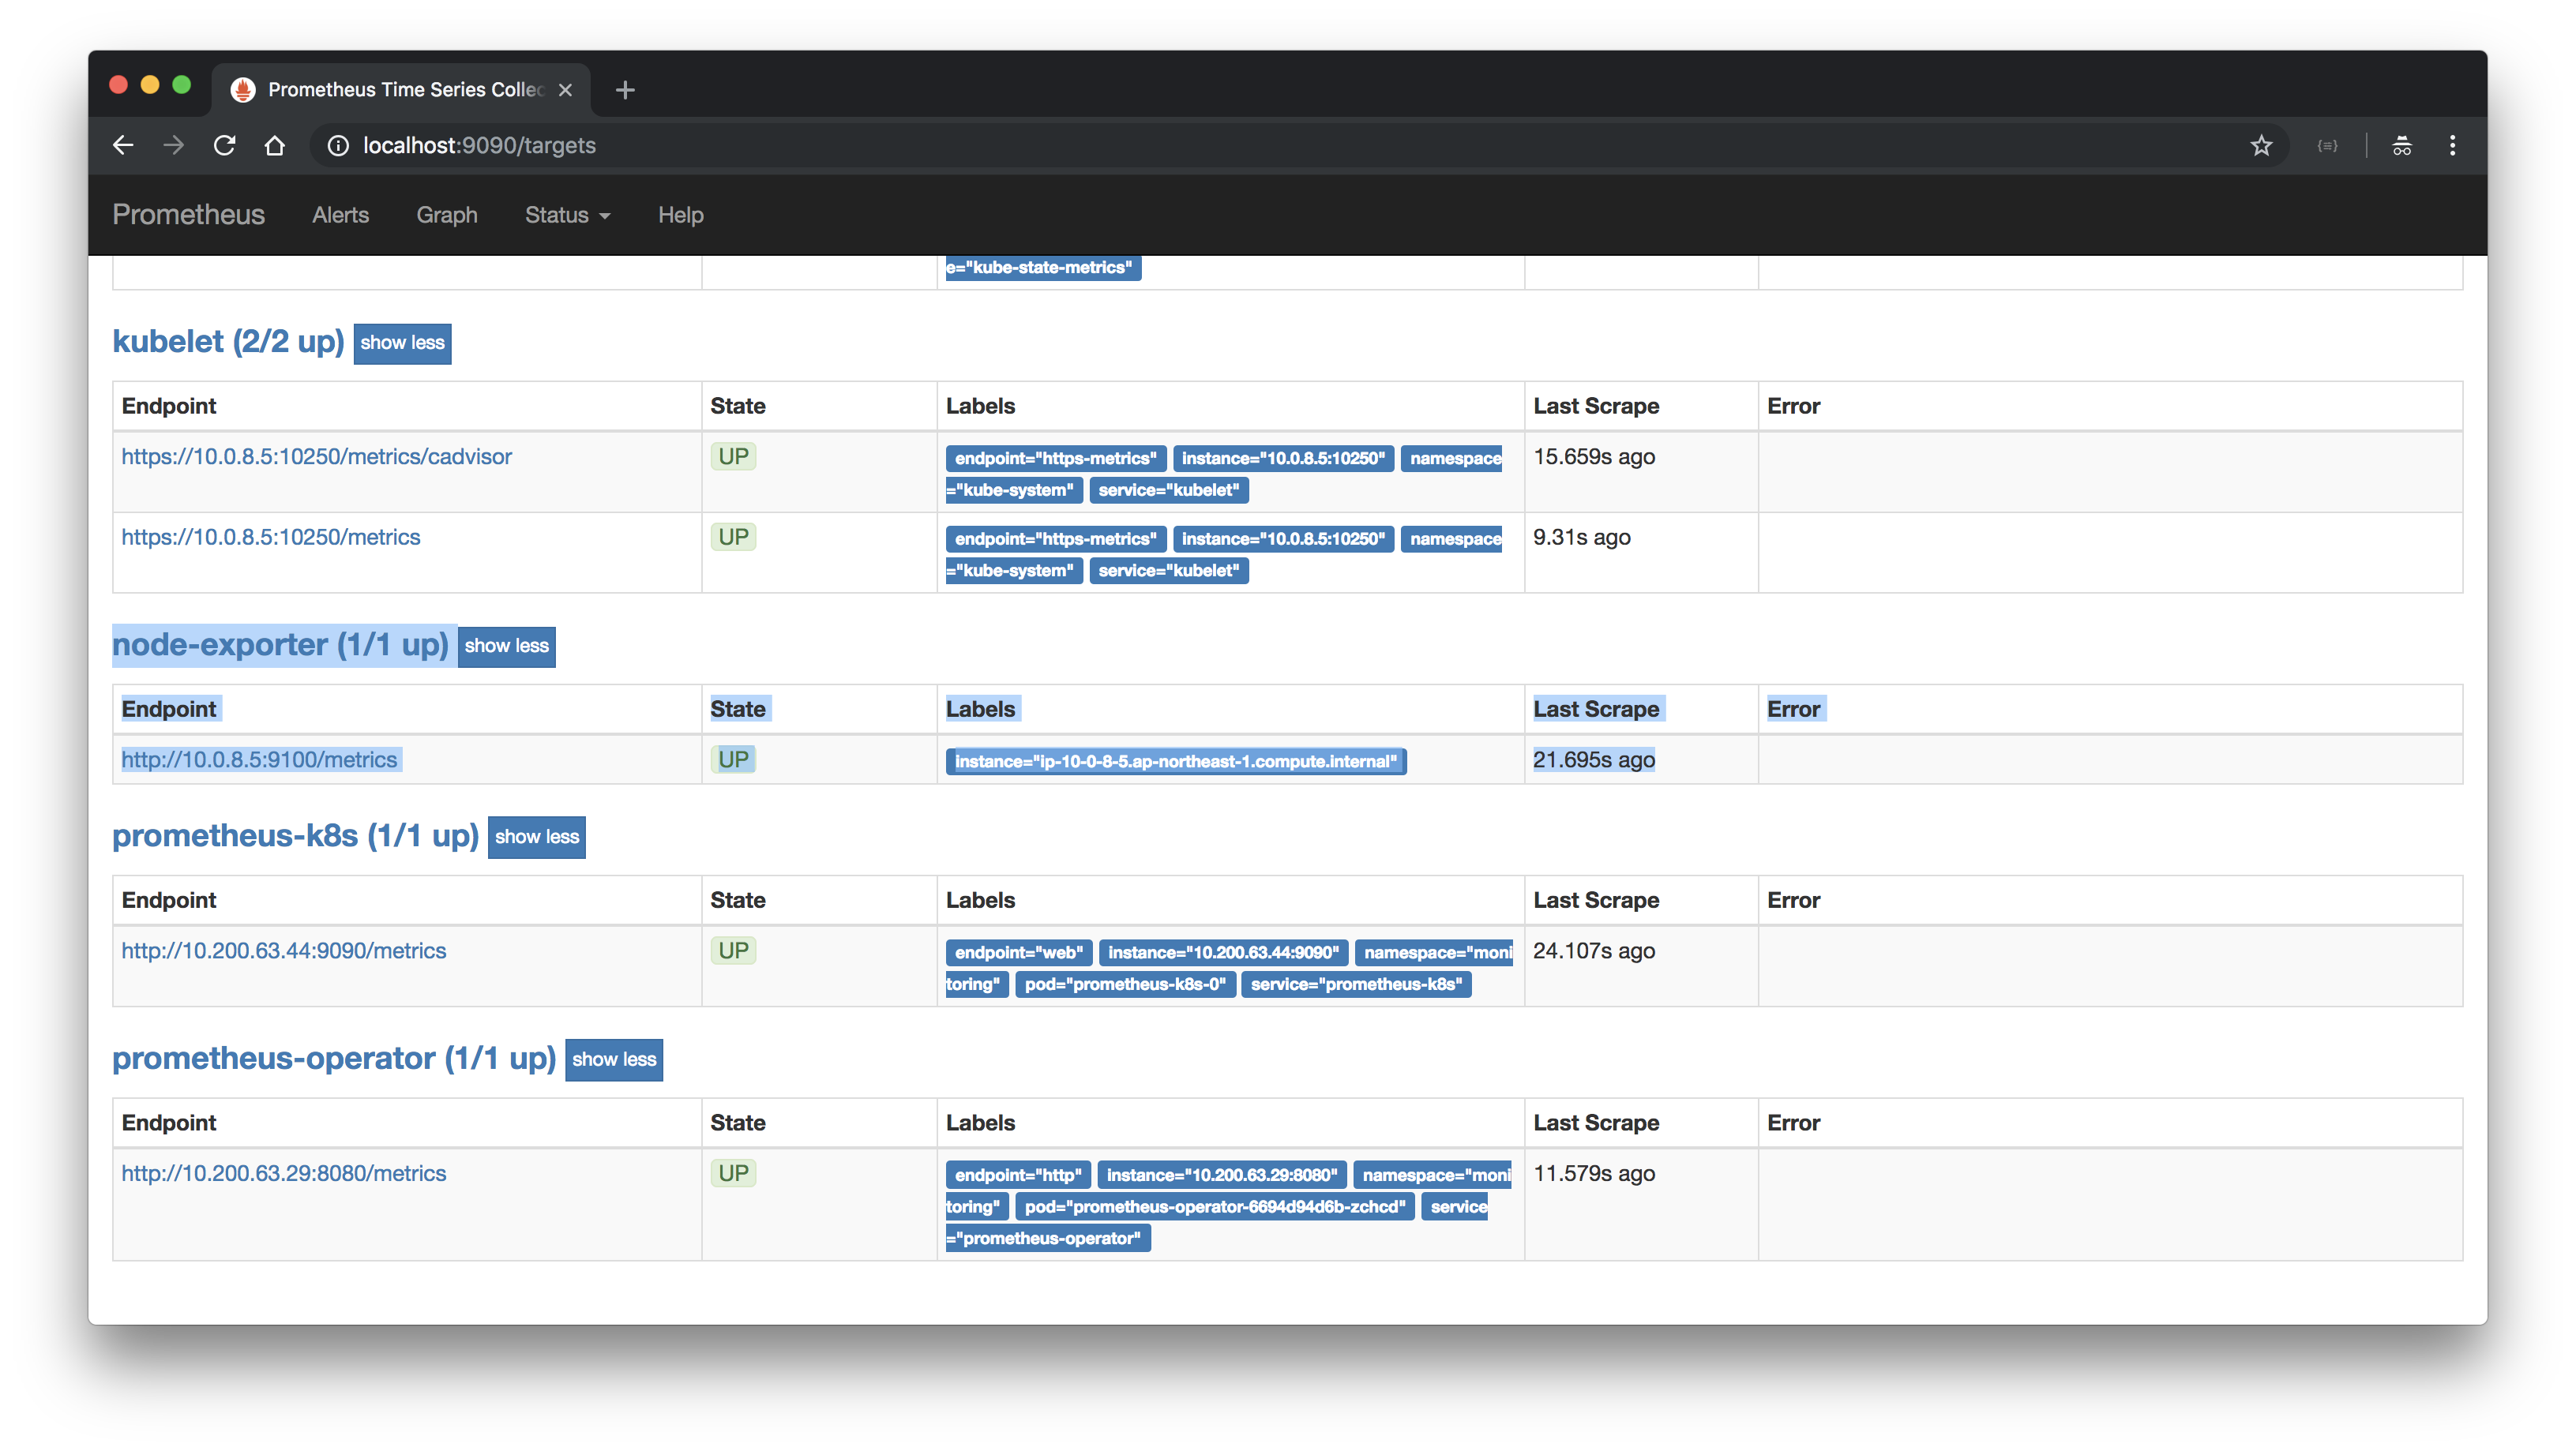
PrometheusのPodがrecreateされ、Targetsを確認すると、Node Exporterが追加されています。
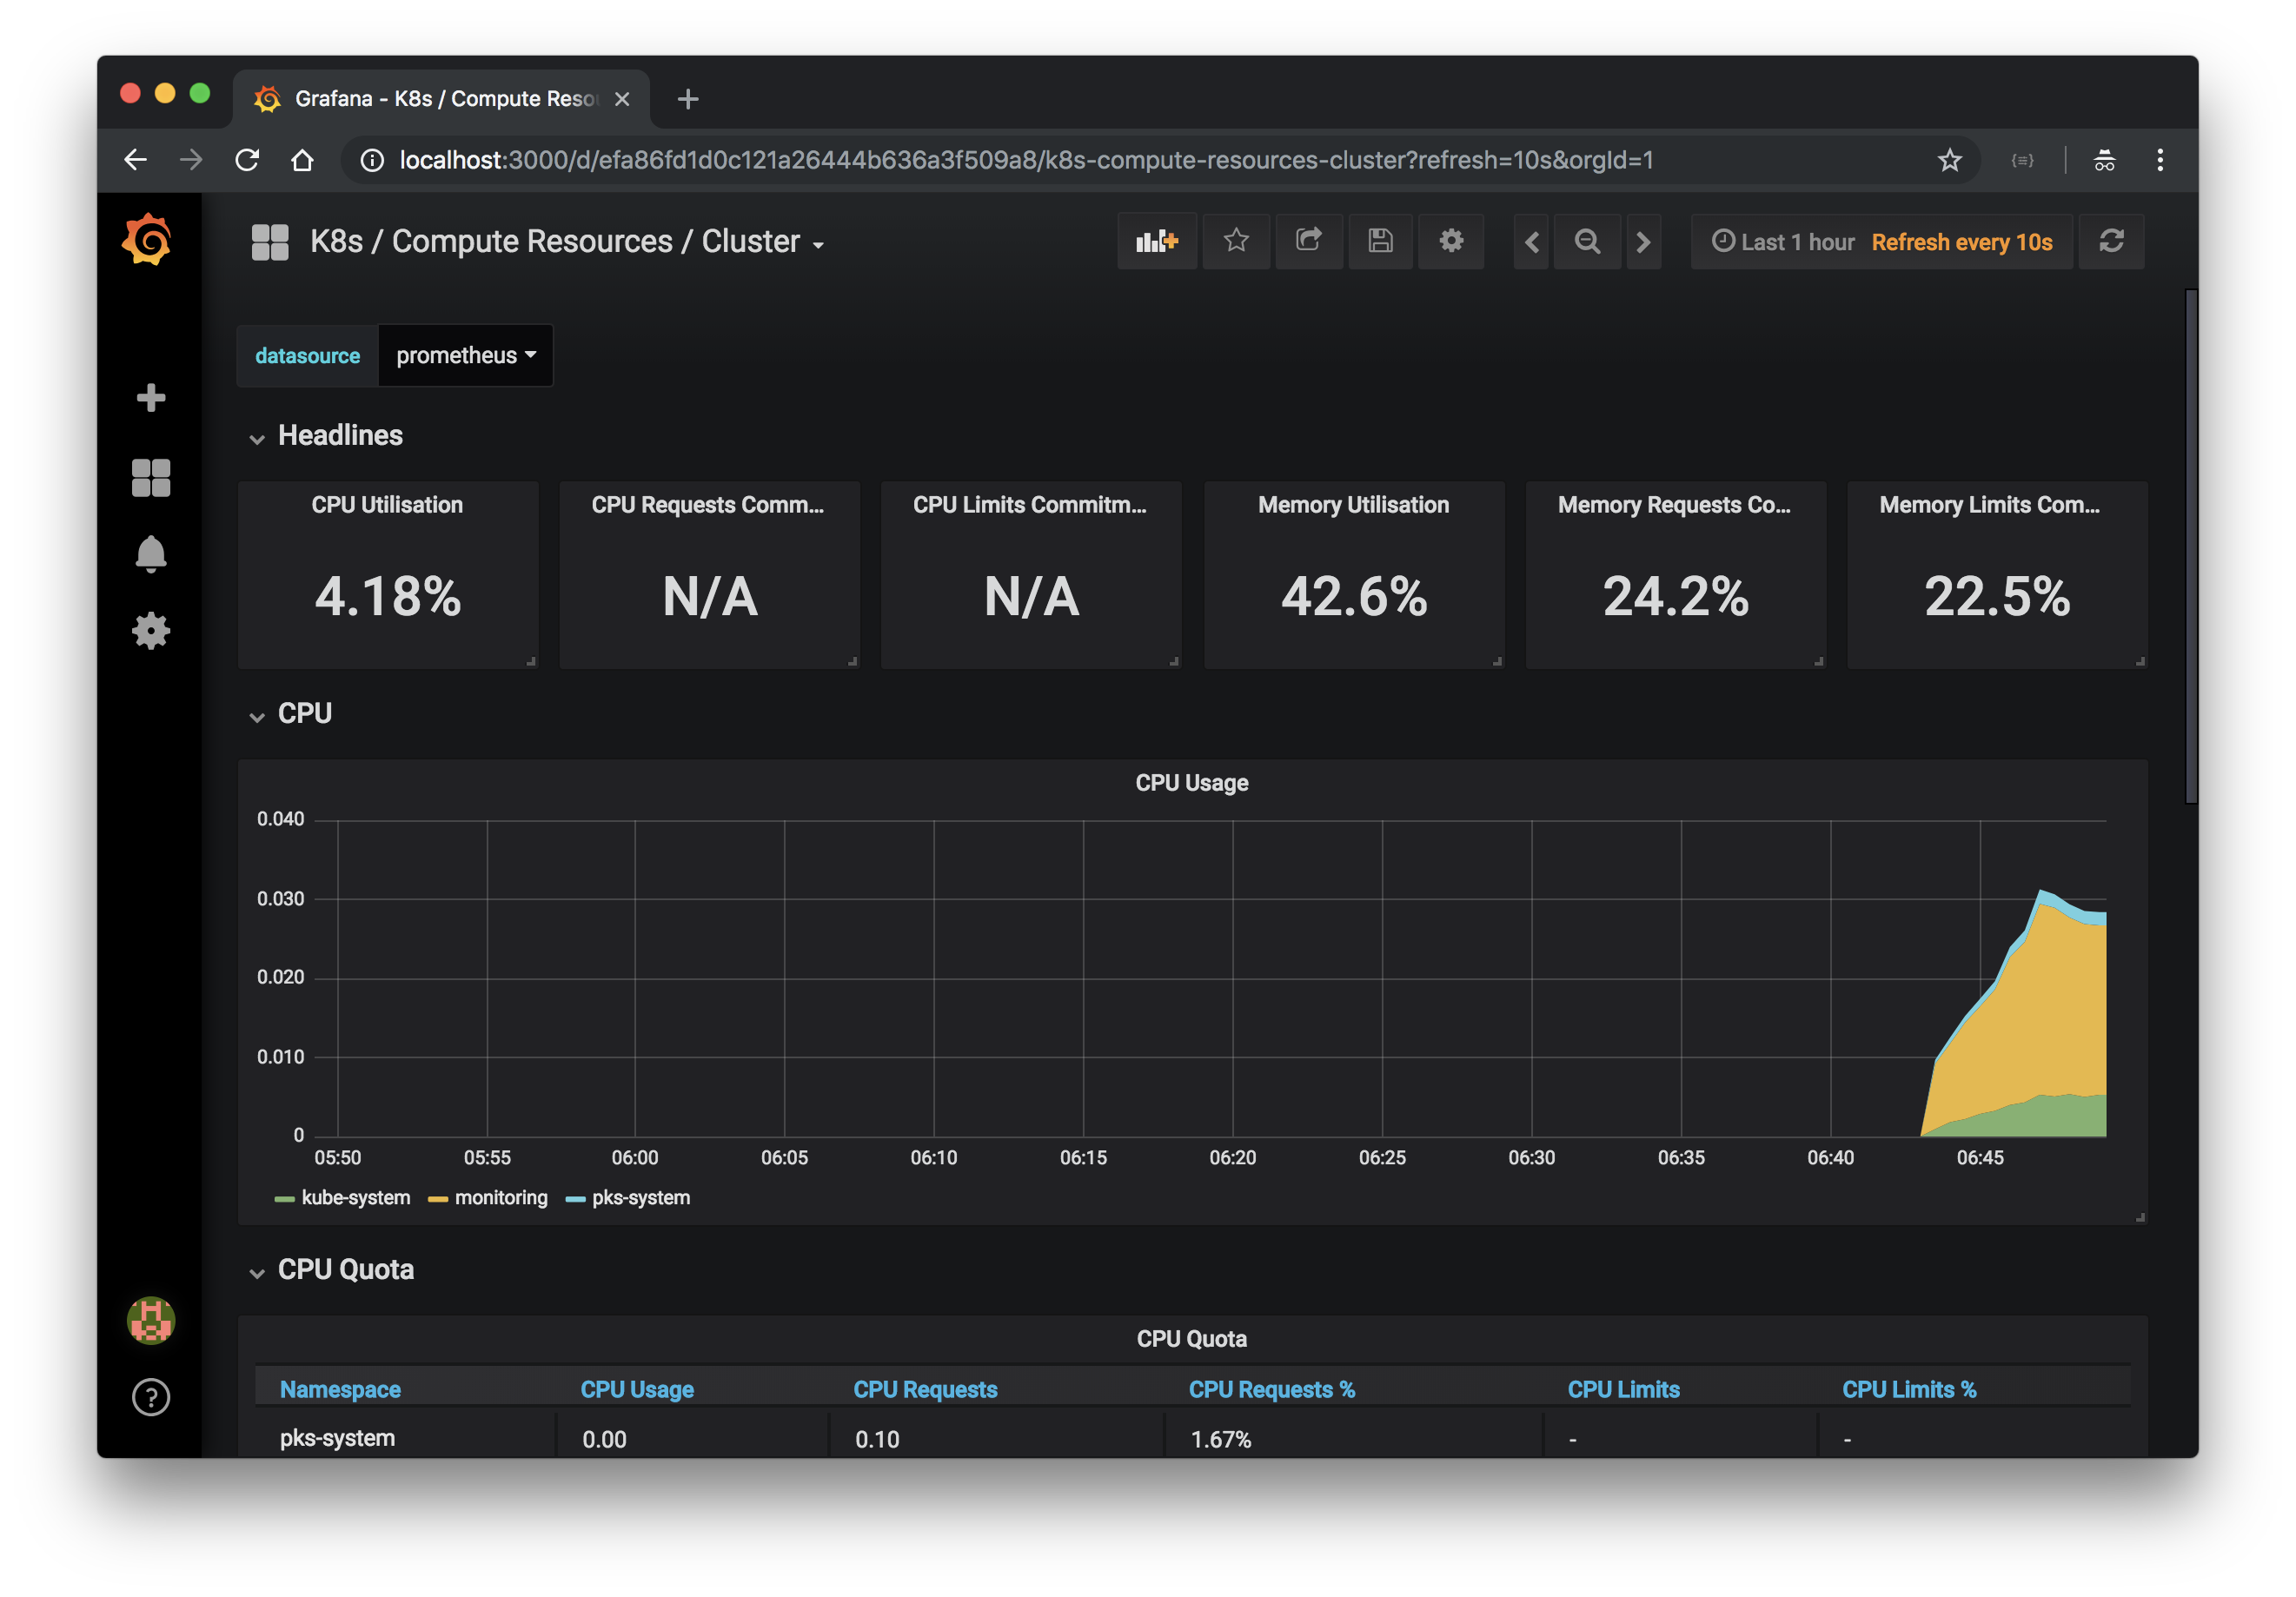
Grafnaにアクセスすると、Nodeに関するメトリクスや
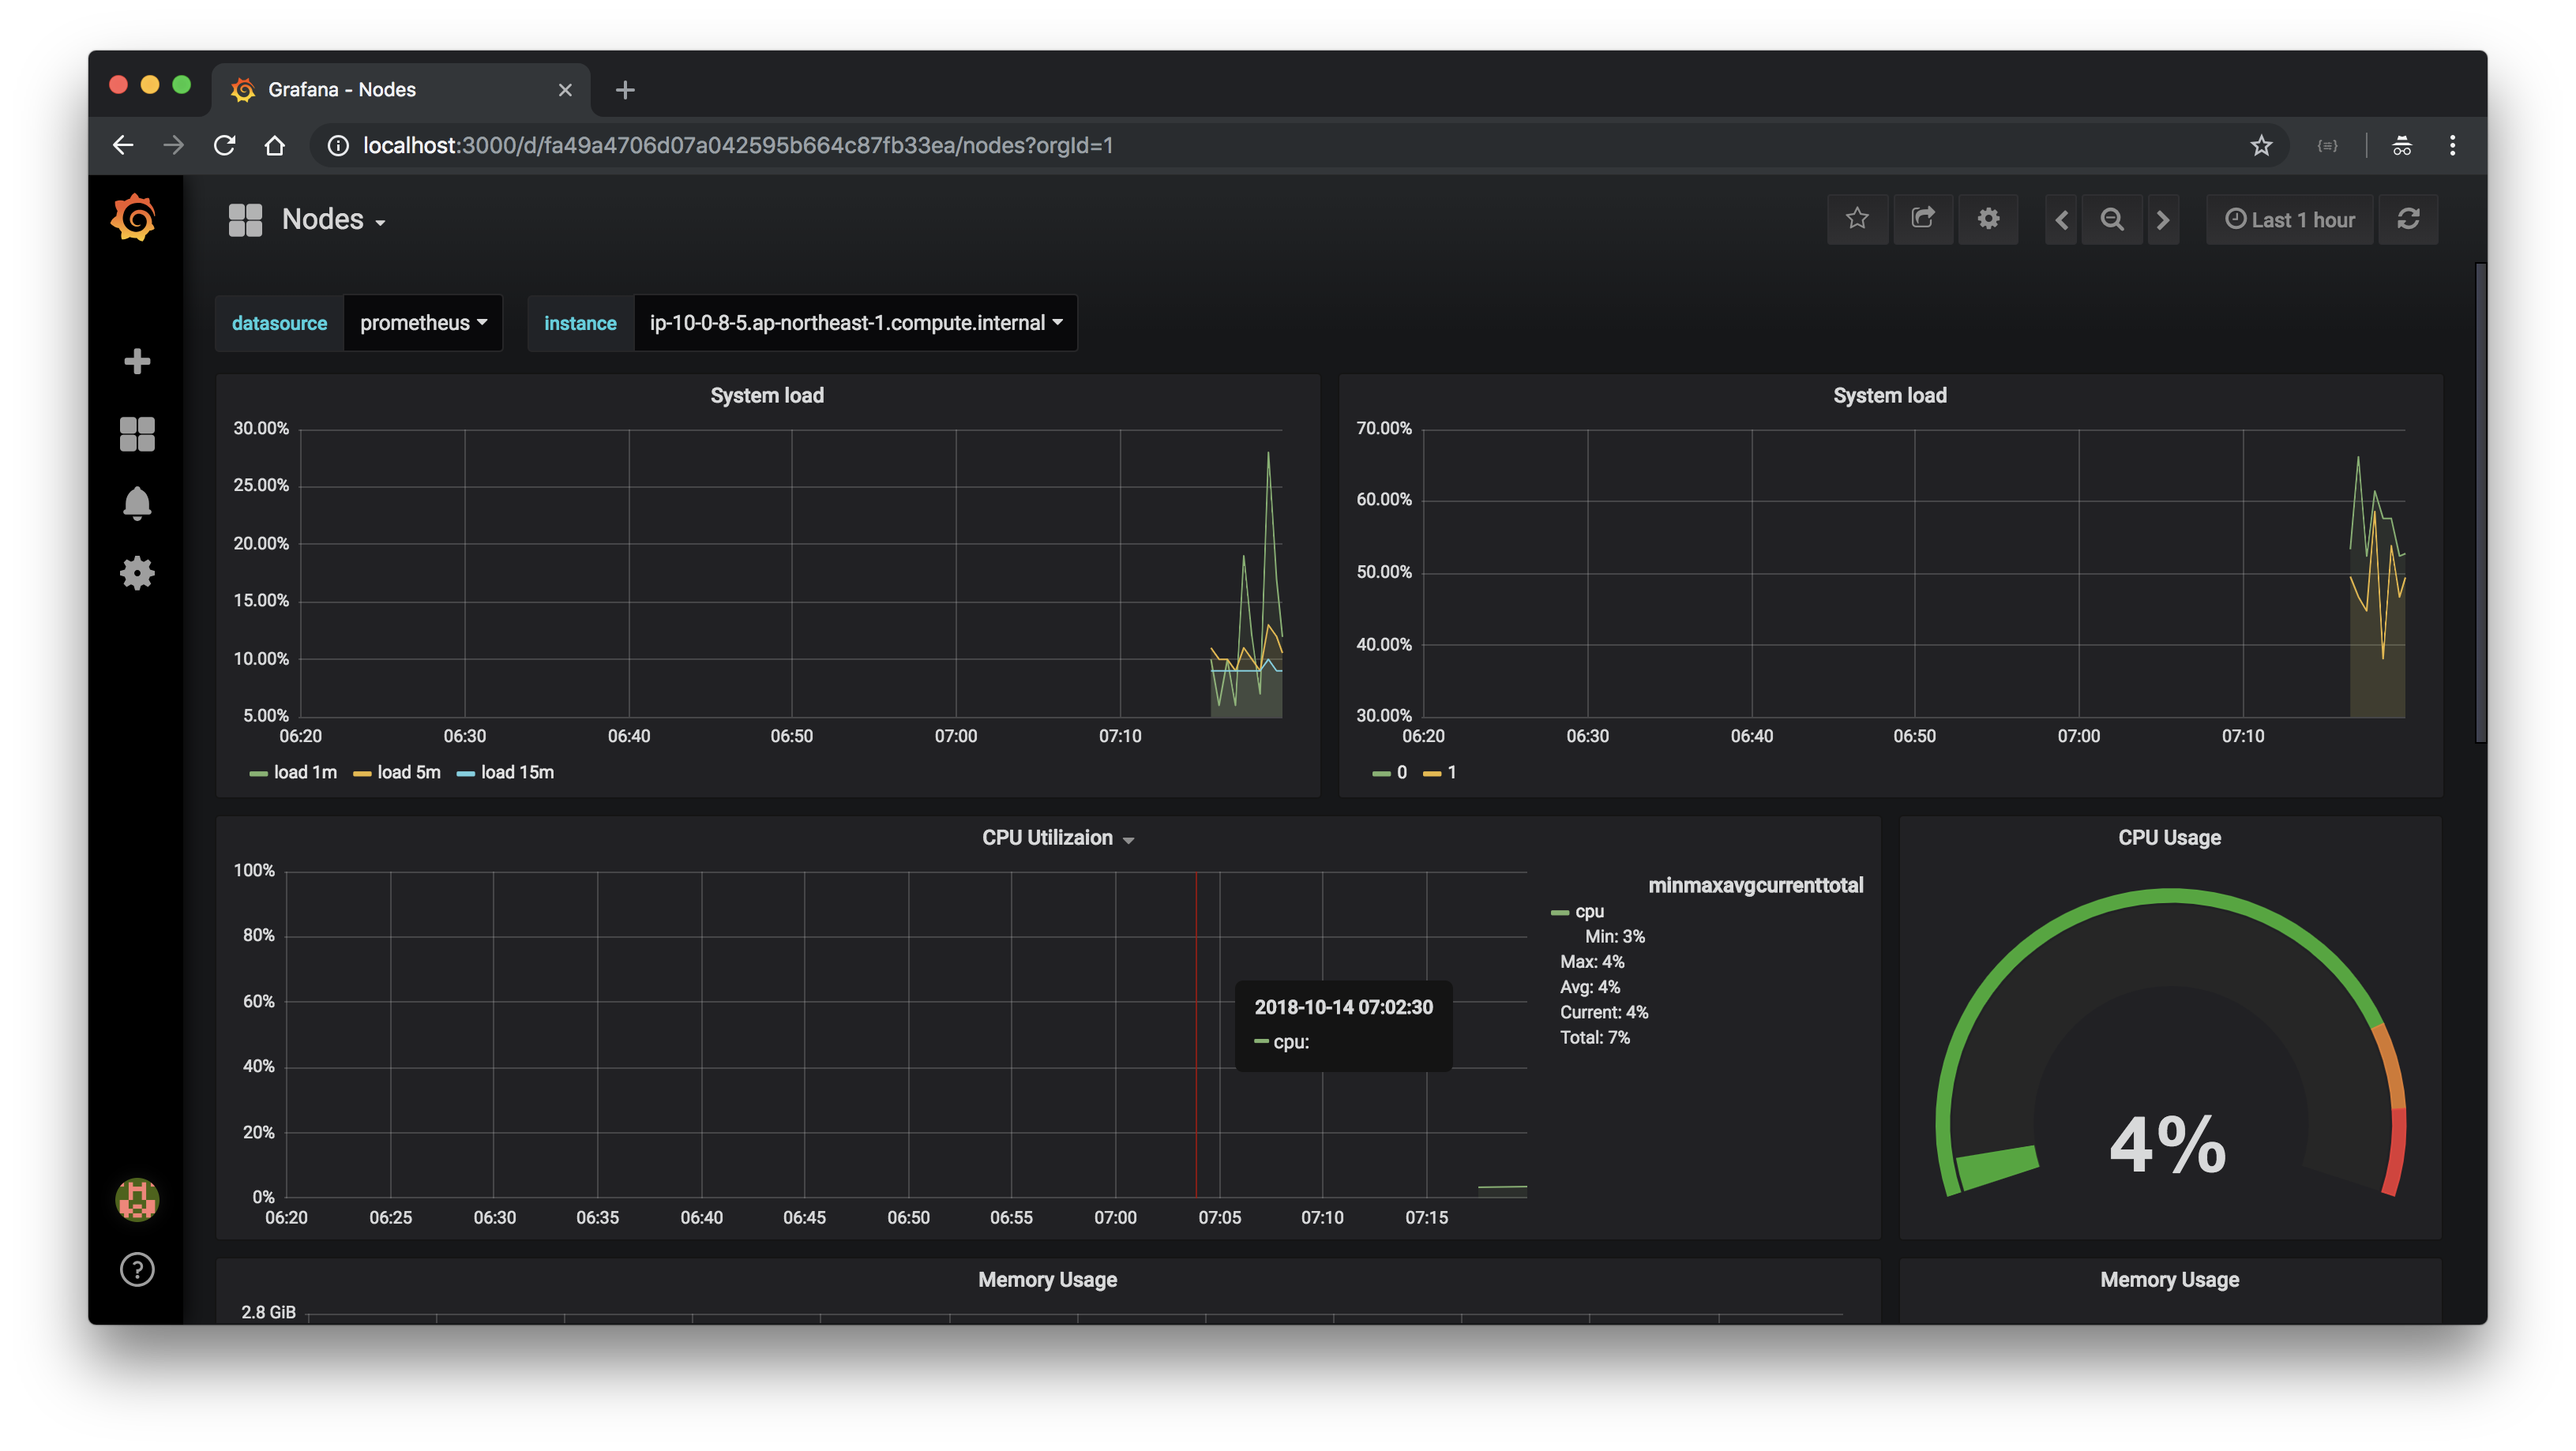
Clusterに関するメトリクスが表示されます。
モニタリング対象の追加
次にServiceMonitorリソースを使って、モニタリング対象を追加します。対象のサンプルアプリケーションはこちらです。
Spring Boot ActuatorとMicrometerを使って/actuator/prometheusエンドポイントでメトリクスをexportしています。
このアプリケーションを次のmanifestでhello Namespaceにデプロイします。Serviceのport定義にnameをつけるのが重要です。
apiVersion: v1
kind: Namespace
metadata:
  name: hello
---
apiVersion: apps/v1
kind: Deployment
metadata:
  name: hello-pks
  namespace: hello
spec:
  replicas: 1
  selector:
    matchLabels:
      app: hello-pks
  template:
    metadata:
      labels:
        app: hello-pks
    spec:
      containers:
      - image: making/hello-pks:0.0.2
        name: hello-pks
        ports:
        - containerPort: 8080
---
kind: Service
apiVersion: v1
metadata:
  name: hello-pks-service
  namespace: hello
  labels:
    app: hello-pks
spec:
  type: NodePort
  selector:
    app: hello-pks
  ports:
  - protocol: TCP
    port: 8080
    name: http
kubectl applyでデプロイします。
kubectl apply -f hello-pks.yml
Prometheus OperatorではNamespace毎にPrometheusリソースを作って個別にPrometheusを立ててもいいですが、
ここでは1クラスタ毎にテナントが用意されていて、Cluster Adminがもらえている前提とし、monitoring NamespaceのPrometheusにモニタリングを集約させます。
monitoring NamespaceのPrometheusがhello NamespaceのPod等の情報にアクセスすために、monitoring Namespaceのprometheus-k8s Service AccountにRoleを追加する必要があります。
ServiceMonitorの定義と一緒に次のhello-pks-monitor.ymlにRoleとRoleBindingも作成します。
apiVersion: monitoring.coreos.com/v1
kind: ServiceMonitor
metadata:
  labels:
    k8s-app: hello-pks
  name: hello-pks
  namespace: hello
spec:
  endpoints:
  - interval: 30s
    port: http
    path: /actuator/prometheus
  namespaceSelector:
    matchNames:
    - hello
  selector:
    matchLabels:
      app: hello-pks
---
apiVersion: rbac.authorization.k8s.io/v1
kind: Role
metadata:
  name: prometheus-k8s
  namespace: hello
rules:
- apiGroups:
  - ""
  resources:
  - nodes
  - services
  - endpoints
  - pods
  verbs:
  - get
  - list
  - watch
---
apiVersion: rbac.authorization.k8s.io/v1
kind: RoleBinding
metadata:
  name: prometheus-k8s
  namespace: hello
roleRef:
  apiGroup: rbac.authorization.k8s.io
  kind: Role
  name: prometheus-k8s
subjects:
- kind: ServiceAccount
  name: prometheus-k8s
  namespace: monitoring
kubectl applyでデプロイします。
kubectl apply -f hello-pks-monitor.yml
しばらくするとPrometheusのConfigurationがアップデートされます。

Targetに追加したアプリケーションが増えていることを確認してください。

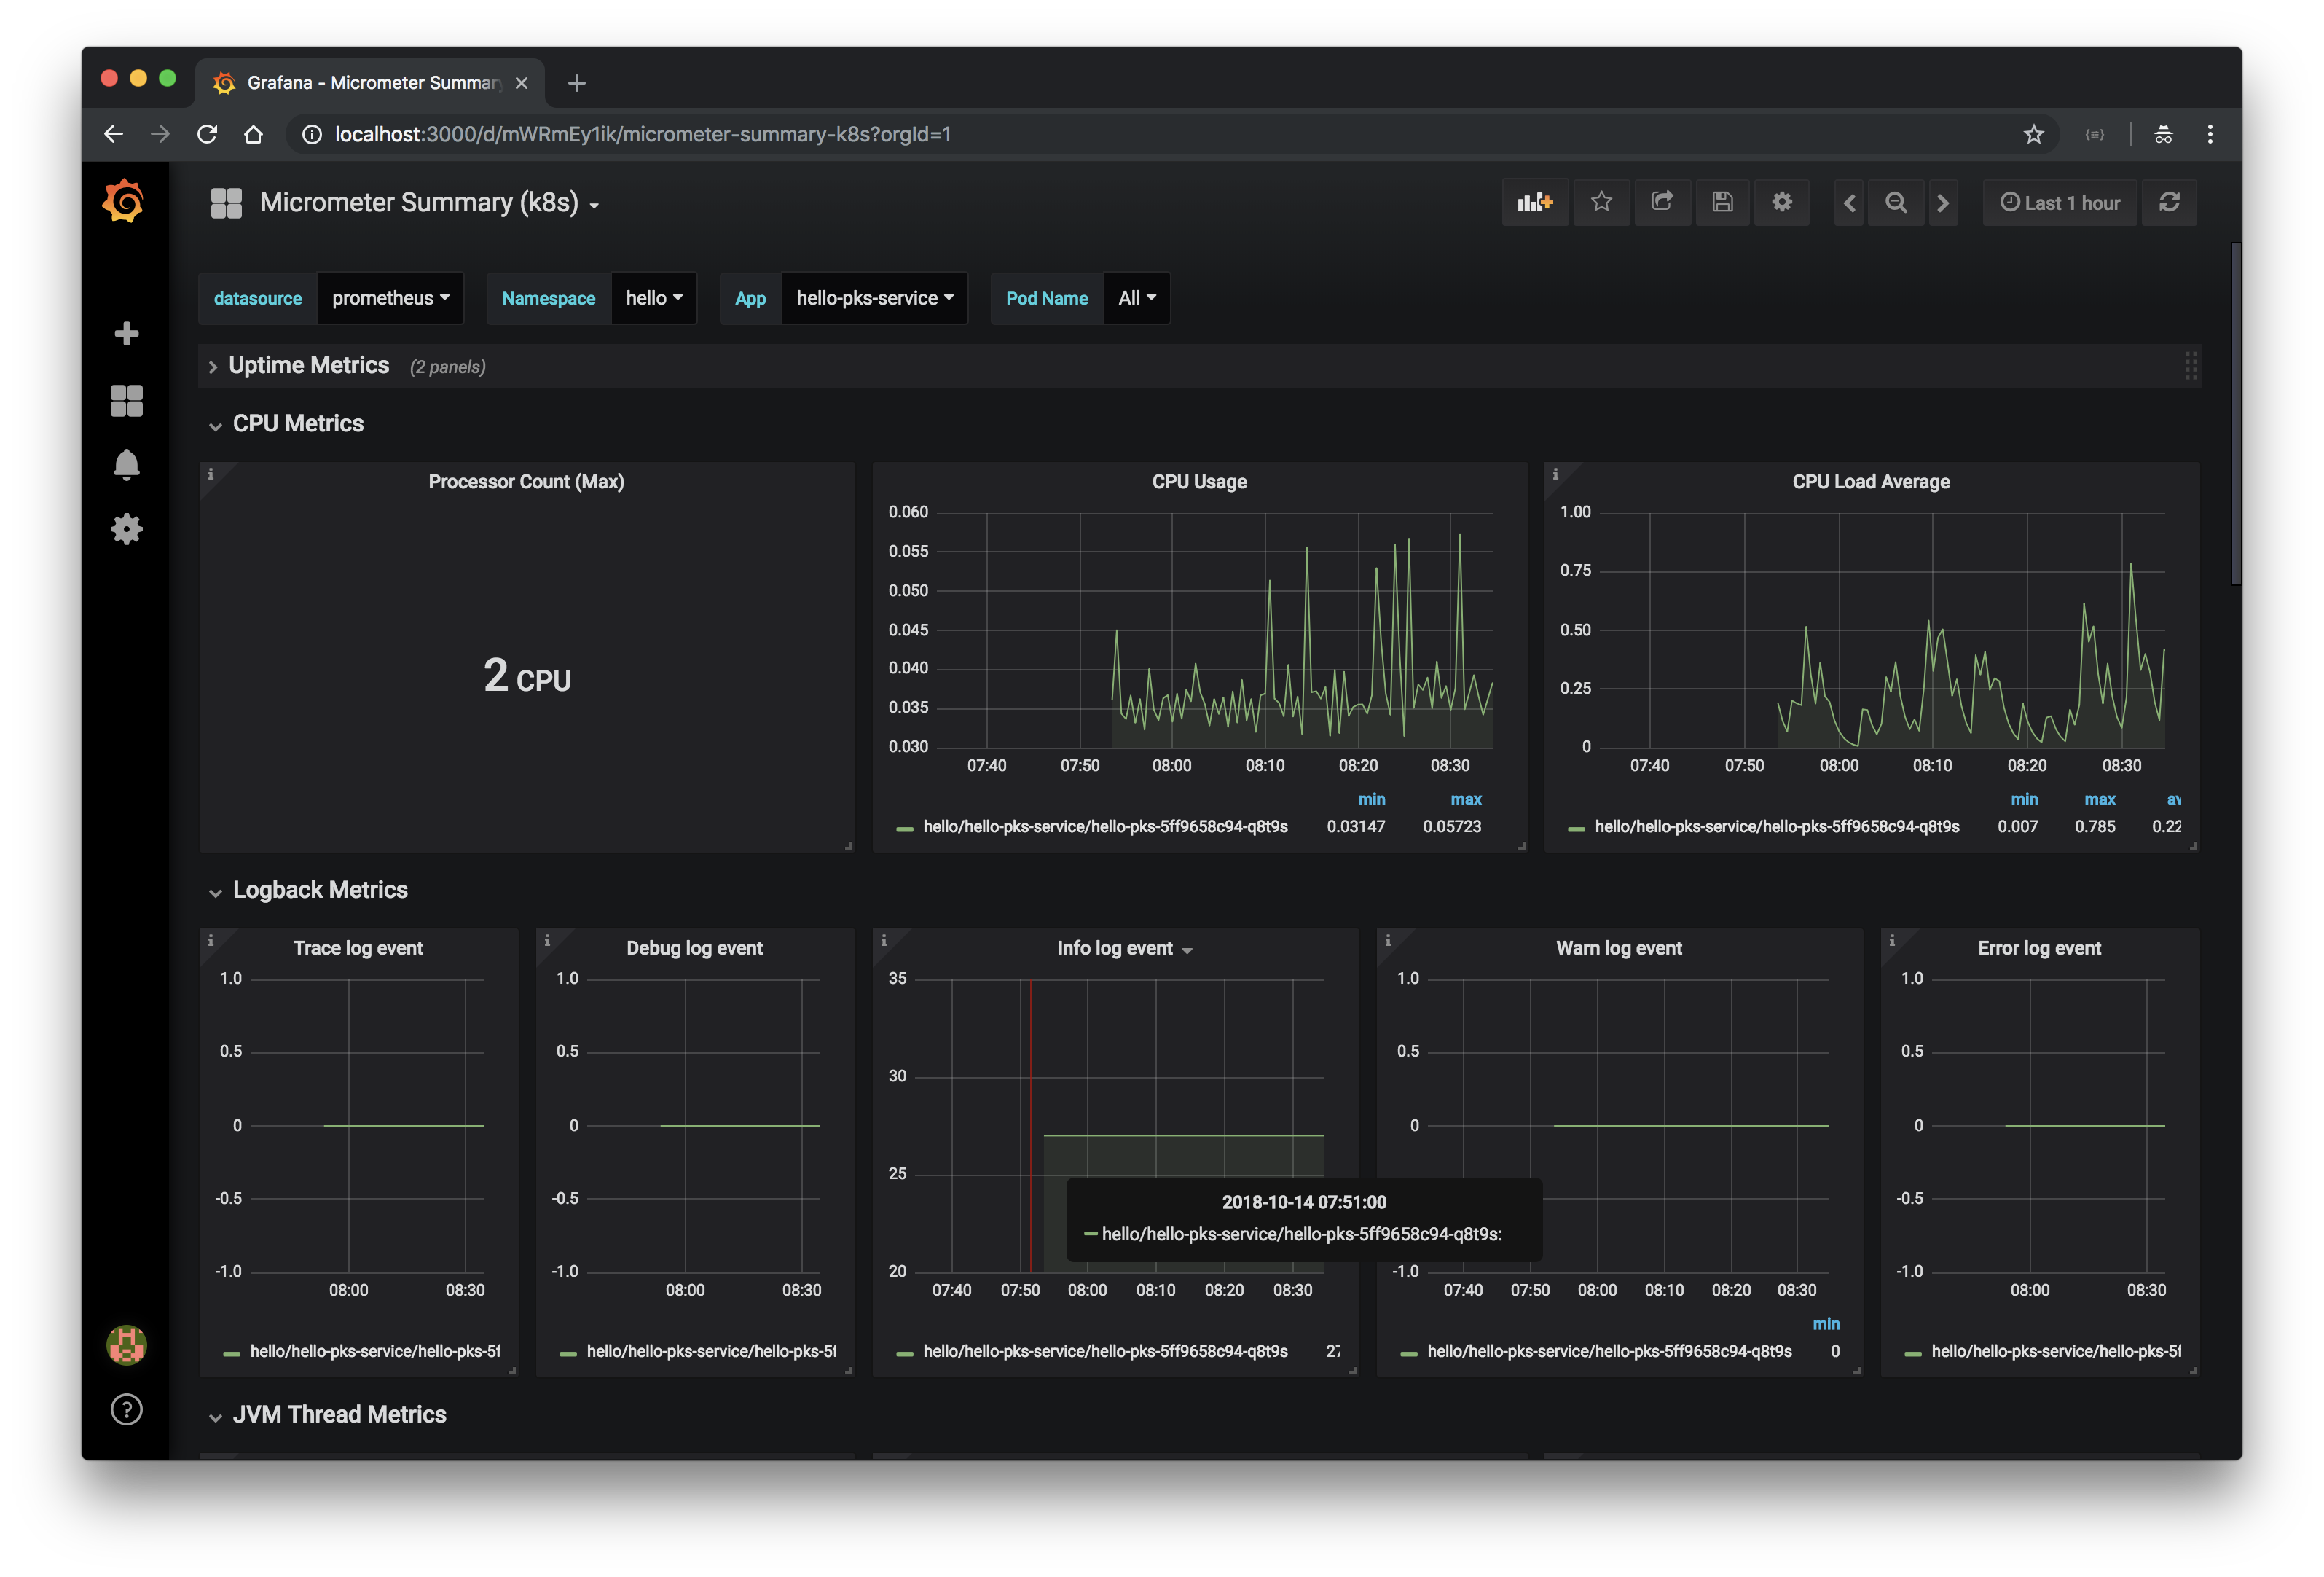
jvm_memory_used_bytesなどMicrometerで取得できるメトリクスを確認してください。

Grafanaダッシュボードの追加
次にGrafanaダッシュボードの追加方法を説明します。
Micrometer用のGrafanaダッシュボードを作成したので、こちらからダウンロードしてmicrometer.jsonというファイル名をつけてください。
このJSONをConfigMapリソースに登録します。
kubectl create -n monitoring configmap grafana-dashboard-micrometer --from-file=micrometer.json --dry-run -oyaml > grafana-micrometer.yml
kubectl apply -f grafana-micrometer.yml
ConfigMapをGrafanaのPodにMountして、自動読み込み対象に追加します。
kubectl patch -n monitoring deployment grafana --type='json' -p='[{"op": "add", "path": "/spec/template/spec/containers/0/volumeMounts/-", "value": {"mountPath": "/grafana-dashboard-definitions/0/micrometer", "name": "grafana-dashboard-micrometer", "readOnly": false}}, {"op": "add", "path": "/spec/template/spec/volumes/-", "value": {"configMap": {"name": "grafana-dashboard-micrometer"}, "name": "grafana-dashboard-micrometer"}}]'
GrafanaのPodが再作成されればDashboardが追加され、Micrometerに関連するメトリクスが表示されます。
なお、ConfigMapを変更するだけだと、Podは自動で再作成されないので、JSONを更新したい場合は
kubectl delete pod -n monitoring -l app=grafana
も実行すると手っ取り早いです。
TODO:=> 本記事の内容をkubectl patchで差分適用すると、Prometheus Operatorをバージョンアップする際にリソースが一度パッチ適用前に戻ってしまう。boshCLIのops-fileなどを使って、YAMLをcompoeseする仕組みが必要。kustomizeで管理する方法はこちら
TODO: AlertManagerの設定
TODO: Prometheusのretention設定(デフォルト: 24h)
Kubernetes結構大変じゃない...?
PKSからOut of the boxなモニタリング機構が欲しい...