---
title: Spring BootアプリのログをLogback + OpenTelemetry (OTLP)で送信する
summary: この記事では、Spring BootでOTLPでログを送る方法を、α版opentelemetry‑logback‑appenderと自作Auto‑Configurationで、logback‑spring.xml不要の設定手順と実装例を紹介します。
tags: ["OpenTelemetry", "Spring Boot", "Lognroll", "Java", "Logging"]
categories: ["Programming", "Java", "org", "springframework", "boot"]
date: 2026-01-23T12:05:56.976Z
updated: 2026-01-23T12:05:56.976Z
---
Spring Boot + Logback でログを OTLP(OpenTelemetry Protocol)で送信したい場合、 [opentelemetry‑logback‑appender](https://github.com/open-telemetry/opentelemetry-java-instrumentation/blob/main/instrumentation/logback/logback-appender-1.0/library) が利用できます。
`logback‑spring.xml`への設定方法は、["OpenTelemetry with Spring Boot"](https://spring.io/blog/2025/11/18/opentelemetry-with-spring-boot) というブログで紹介されています。この appender は GA 版ではなく、(長い間)α バージョンです。α バージョンである限り、Spring Boot 側でAuto Configurationが提供されることは期待できません(実際に Breaking Changes もありました。`OpenTelemetry` オブジェクト自体は Auto Configuration されます)。
とはいえ、毎回 `logback‑spring.xml` を手動で用意するのは手間です。そこで私は、以下の Auto Configuration ライブラリを作成し、α 版の appender が GA になるまでの暫定的なサポートとして利用しています。
https://github.com/making/otel-logs-autoconfigure
この Auto Configuration は Spring Boot 3.5 系と 4 系の両方に対応しているので、各バージョンでの使い方を順に紹介します。
> [!NOTE]
> otel-logs-autoconfigure 0.6.0以降でlog4j2もサポートされています
### OTLP バックエンド(Lognroll)の準備
ログを受け取る OTLP エンドポイントとして、軽量な Lognrollを使用します。
リポジトリは https://github.com/categolj/lognroll です。
Dockerで次のように起動できます:
```bash
docker run --rm -p 4318:4318 ghcr.io/categolj/lognroll:native
```
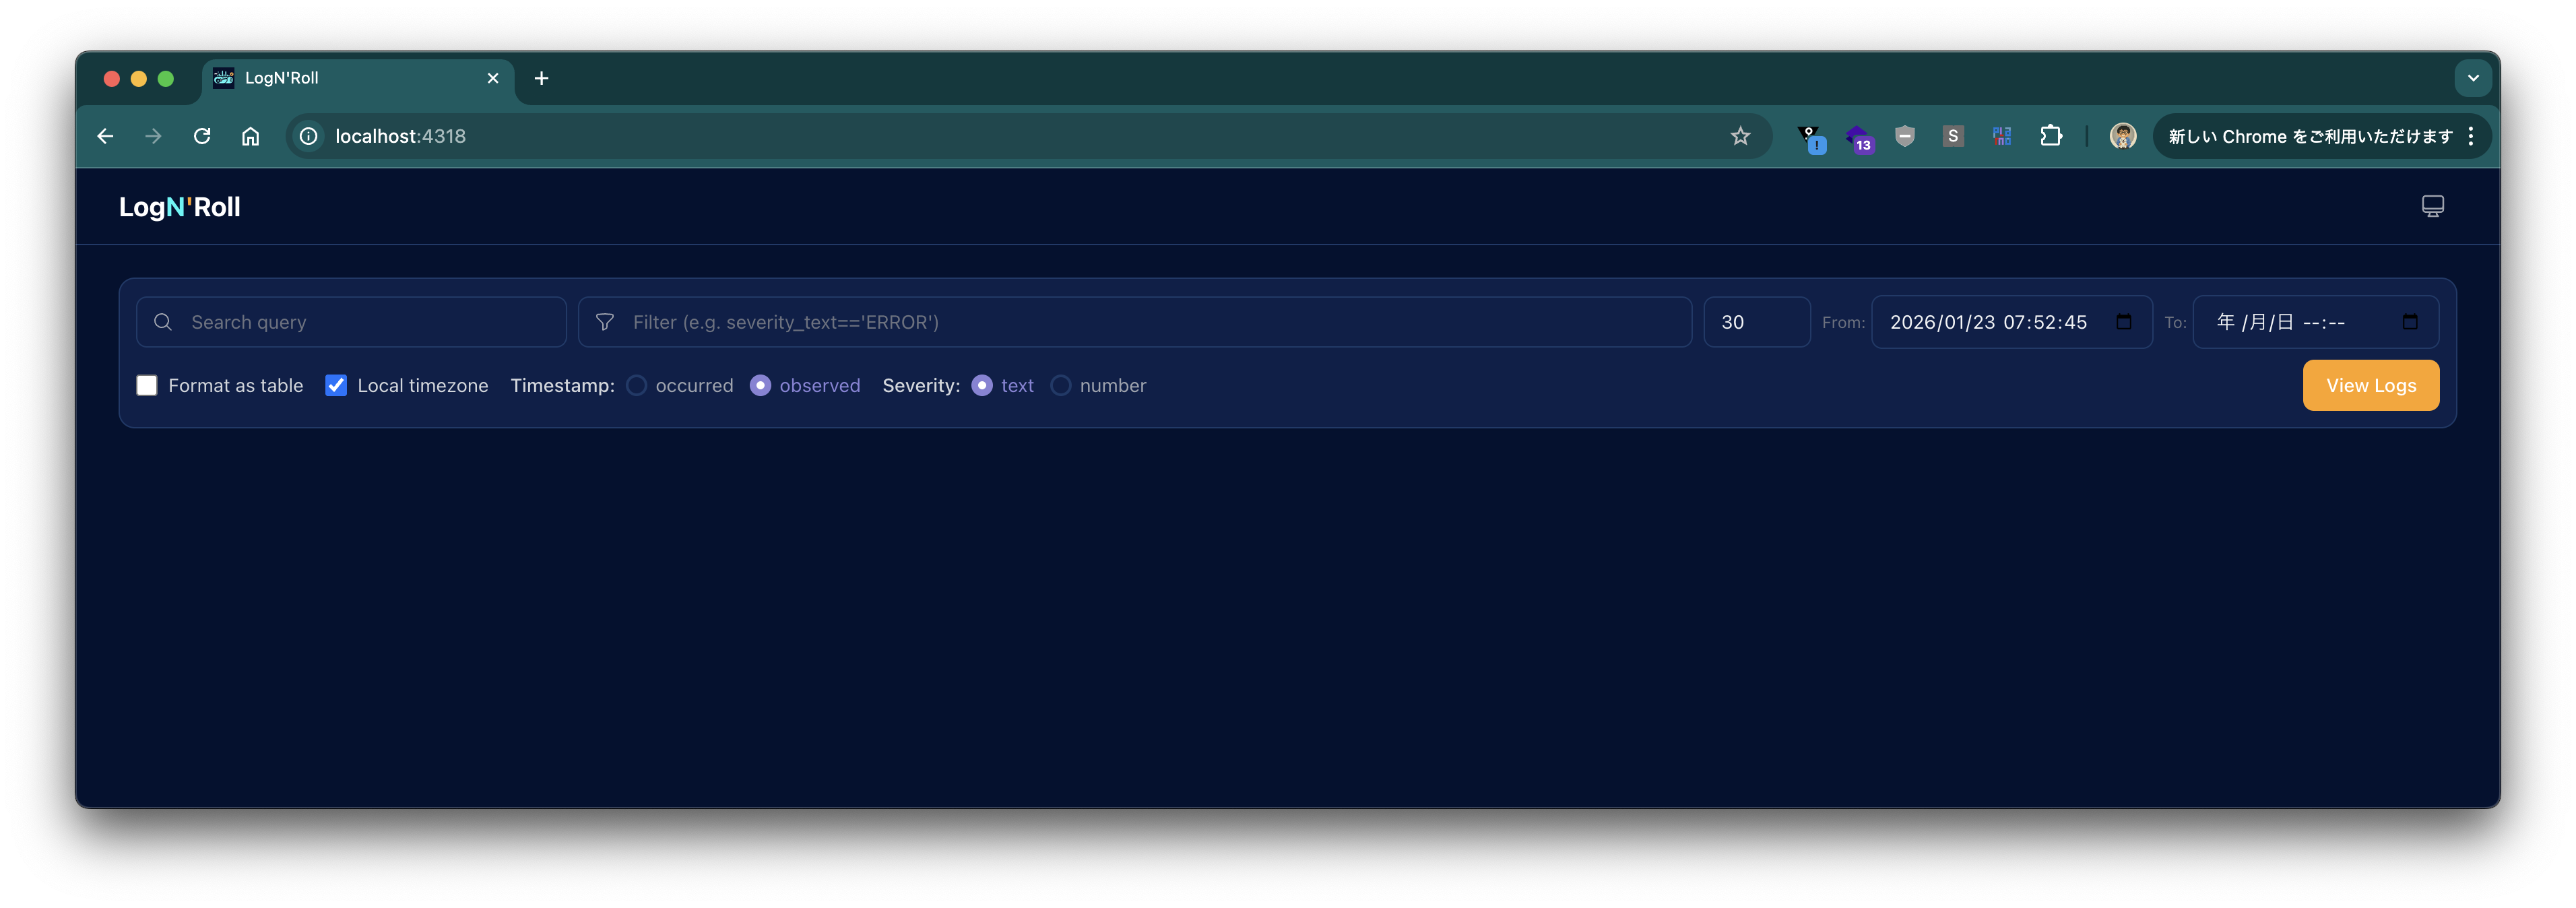
起動後、ブラウザで `http://localhost:4318` にアクセスし、**ユーザー名: 空、パスワード: `changeme`** でログインすると次の画面が表示されます。
### Spring Boot 4+ の場合
次のコマンドでプロジェクトを作成します:
```bash
curl -s https://start.spring.io/starter.tgz \
-d artifactId=demo-otel-logs \
-d name=demo-otel-logs \
-d baseDir=demo-otel-logs \
-d packageName=com.example \
-d dependencies=web,actuator,configuration-processor,prometheus,opentelemetry,native \
-d type=maven-project \
-d applicationName=DemoOtelLogsApplication | tar -xzvf -
cd demo-otel-logs
```
`pom.xml` に以下を追記します。
```xml
am.ik.spring.opentelemetry
otel-logs-autoconfigure-logback
0.6.0
```
`src/main/resources/application.properties` に次のプロパティを記述します。
```properties
logging.level.web=debug
# OpenTelemetry Logback Appender の実験的属性取得を有効化
management.opentelemetry.instrumentation.logback-appender.capture-experimental-attributes=true
management.opentelemetry.instrumentation.logback-appender.capture-key-value-pair-attributes=true
# OTLP エクスポート先
management.opentelemetry.logging.export.otlp.endpoint=http://localhost:4318/v1/logs
management.opentelemetry.logging.export.otlp.compression=gzip
management.opentelemetry.logging.export.otlp.headers.Authorization=Bearer changeme
# 今回はメトリクスは使用しないので無効化
management.otlp.metrics.export.enabled=false
```
### Spring Boot 3.5 の場合
次のコマンドでプロジェクトを作成します:
```bash
curl -s https://start.spring.io/starter.tgz \
-d artifactId=demo-otel-logs \
-d name=demo-otel-logs \
-d baseDir=demo-otel-logs \
-d packageName=com.example \
-d dependencies=web,actuator,configuration-processor,prometheus,native \
-d type=maven-project \
-d bootVersion=3.5.10 \
-d applicationName=DemoOtelLogsApplication | tar -xzvf -
cd demo-otel-logs
```
Spring Boot 3.5 系では OpenTelemetry 用のスターターが提供されていないため、Trace ID と連携させるために Micrometer のブリッジも追加します。
```xml
am.ik.spring.opentelemetry
otel-logs-autoconfigure-logback
0.6.0
io.micrometer
micrometer-tracing-bridge-otel
```
また、`otel-logs-autoconfigure:0.5.0` が内部で使用している Logback Appender のバージョンは、Spring Boot 3.5 が管理している OpenTelemetry Java SDK のバージョンでは動作しません。そのため、`pom.xml` の `` に以下を追加してバージョンを上書きします。
```xml
1.55.0
```
`application.properties` の内容は Spring Boot 4+ とOTLP エクスポート先のプロパティが異なります。
```properties
logging.level.web=debug
# OpenTelemetry Logback Appender の実験的属性取得を有効化
management.opentelemetry.instrumentation.logback-appender.capture-experimental-attributes=true
management.opentelemetry.instrumentation.logback-appender.capture-key-value-pair-attributes=true
# OTLP エクスポート先
management.otlp.logging.endpoint=http://localhost:4318/v1/logs
management.otlp.logging.compression=gzip
management.otlp.logging.headers.Authorization=Bearer changeme
# 今回はメトリクスは使用しないので無効化
management.otlp.metrics.export.enabled=false
```
### ビルドと動作確認
次のコマンドでビルドします:
```bash
./mvnw clean package -DskipTests
```
次のコマンドで実行します:
```bash
java -jar target/demo-otel-logs-0.0.1-SNAPSHOT.jar
```
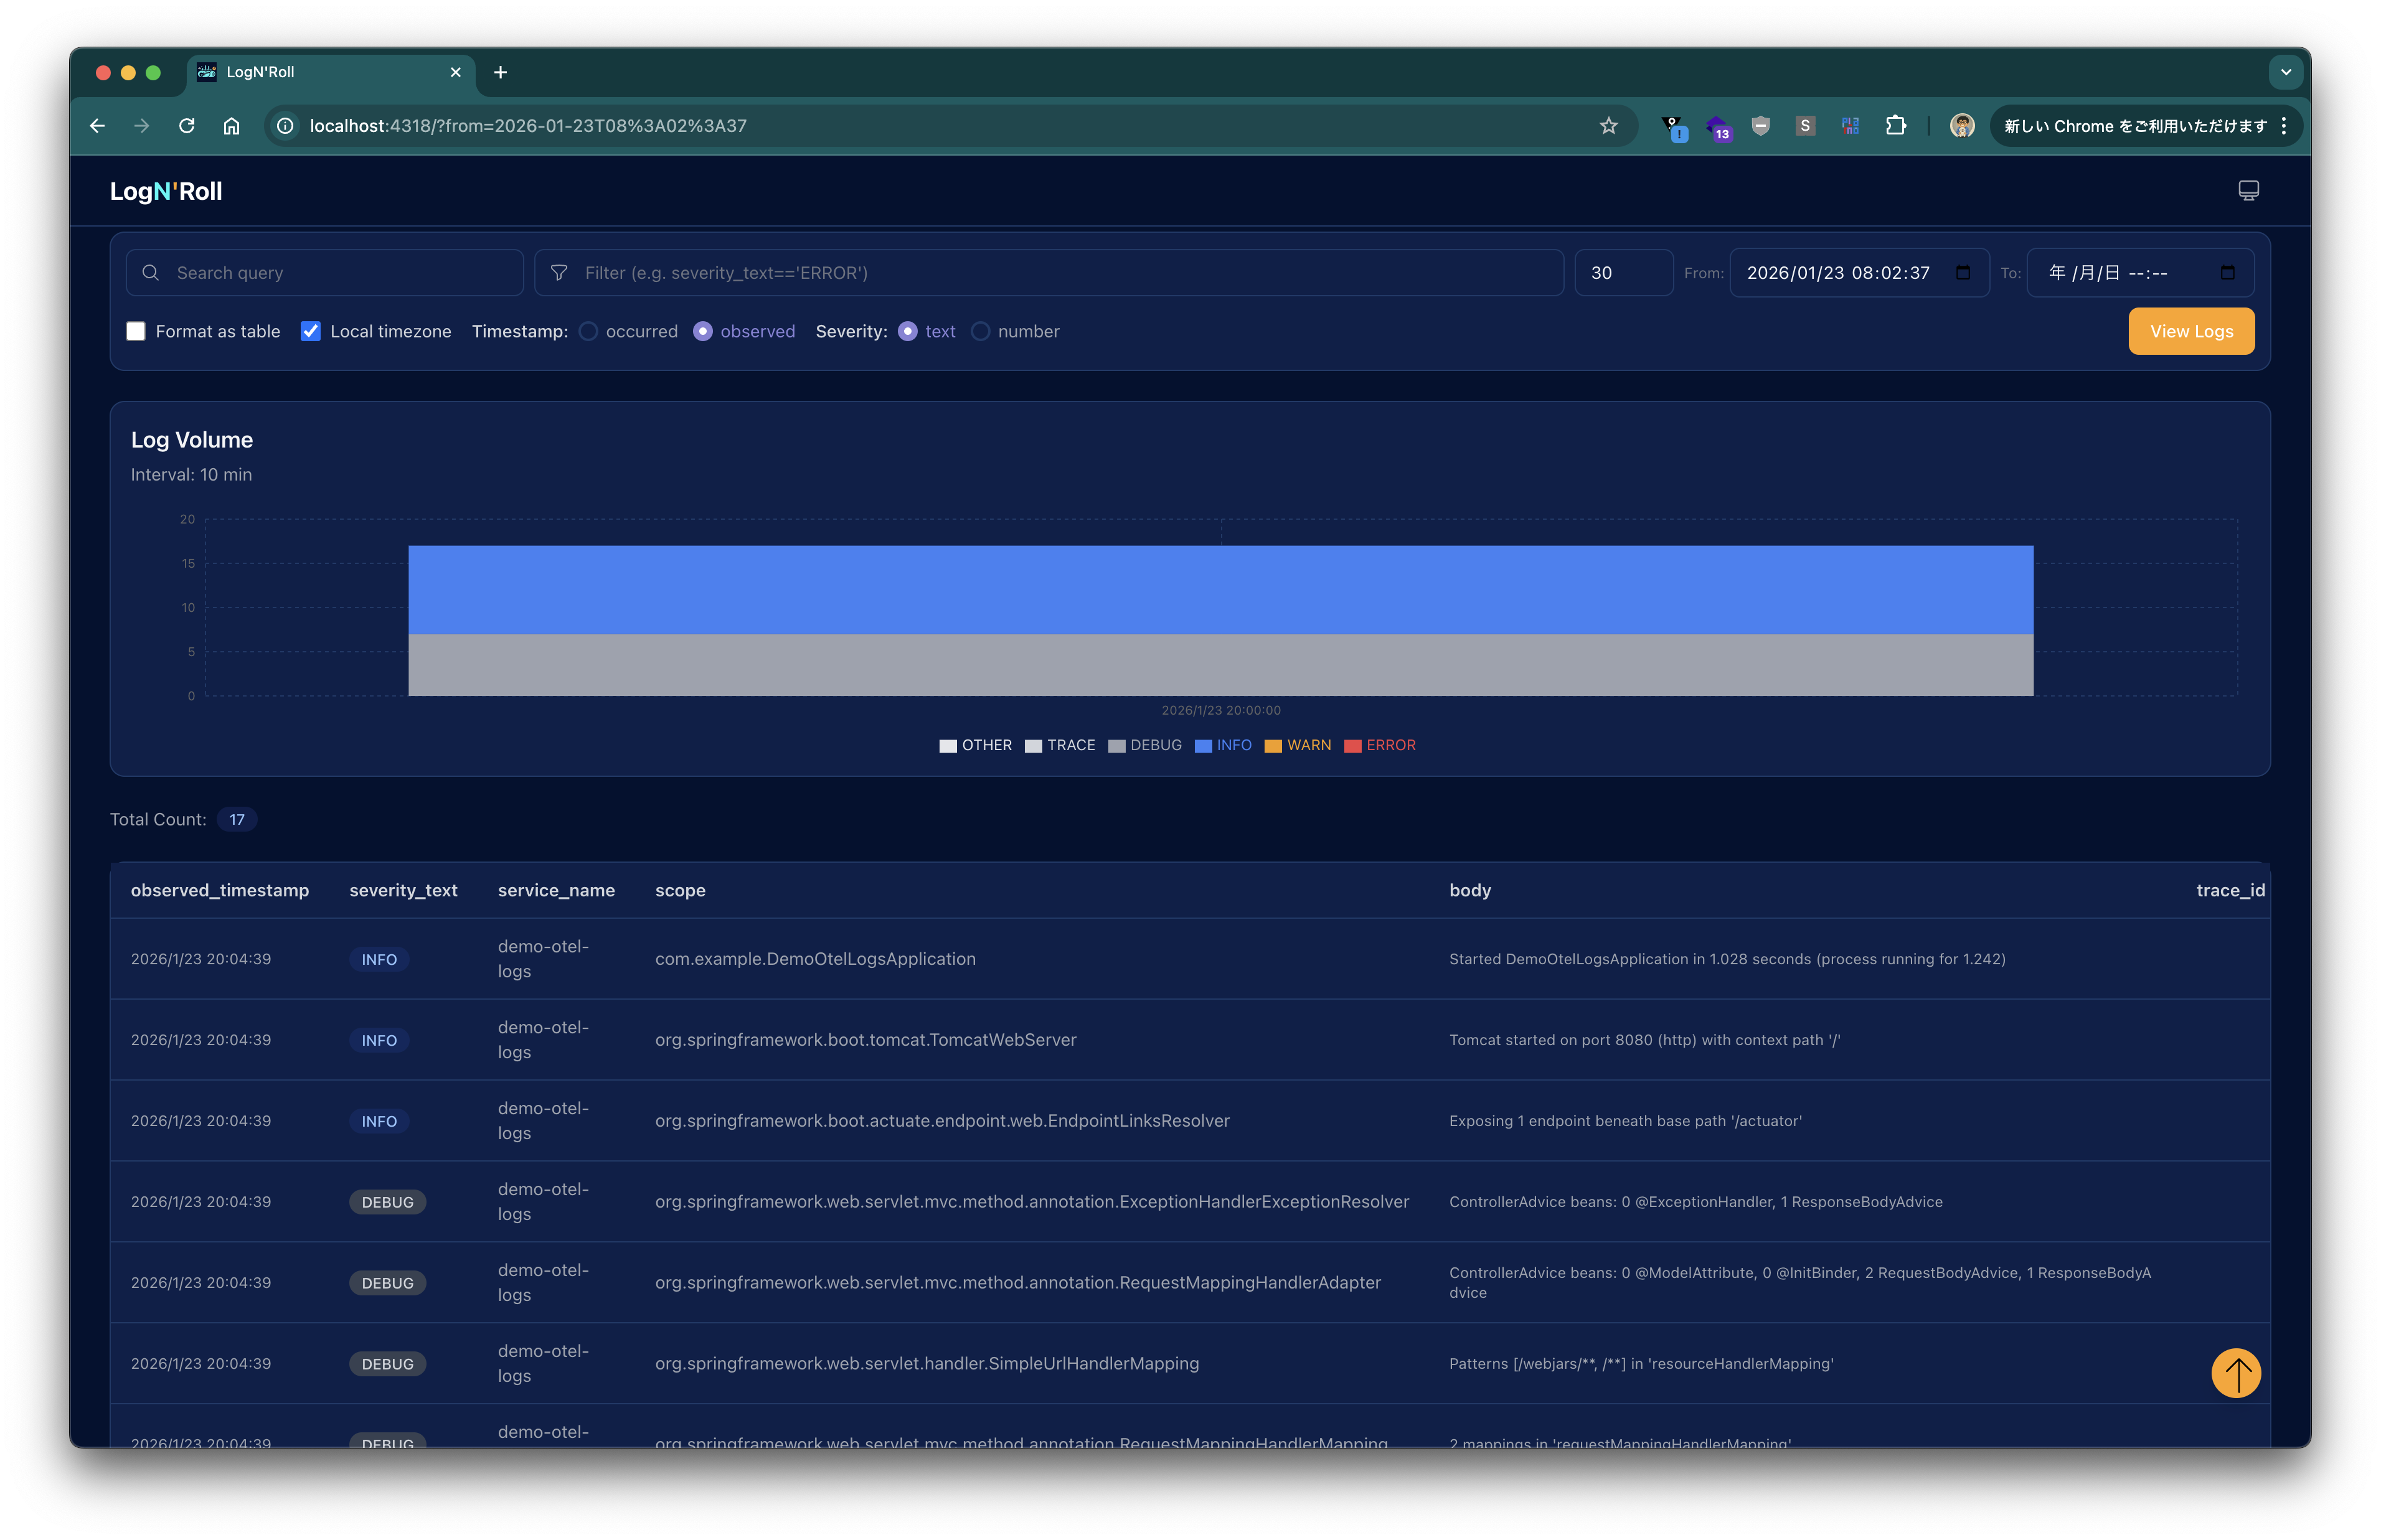
起動後、Lognroll の UI で "View Logs" ボタンをクリックすると、以下のようにログが表示されます。
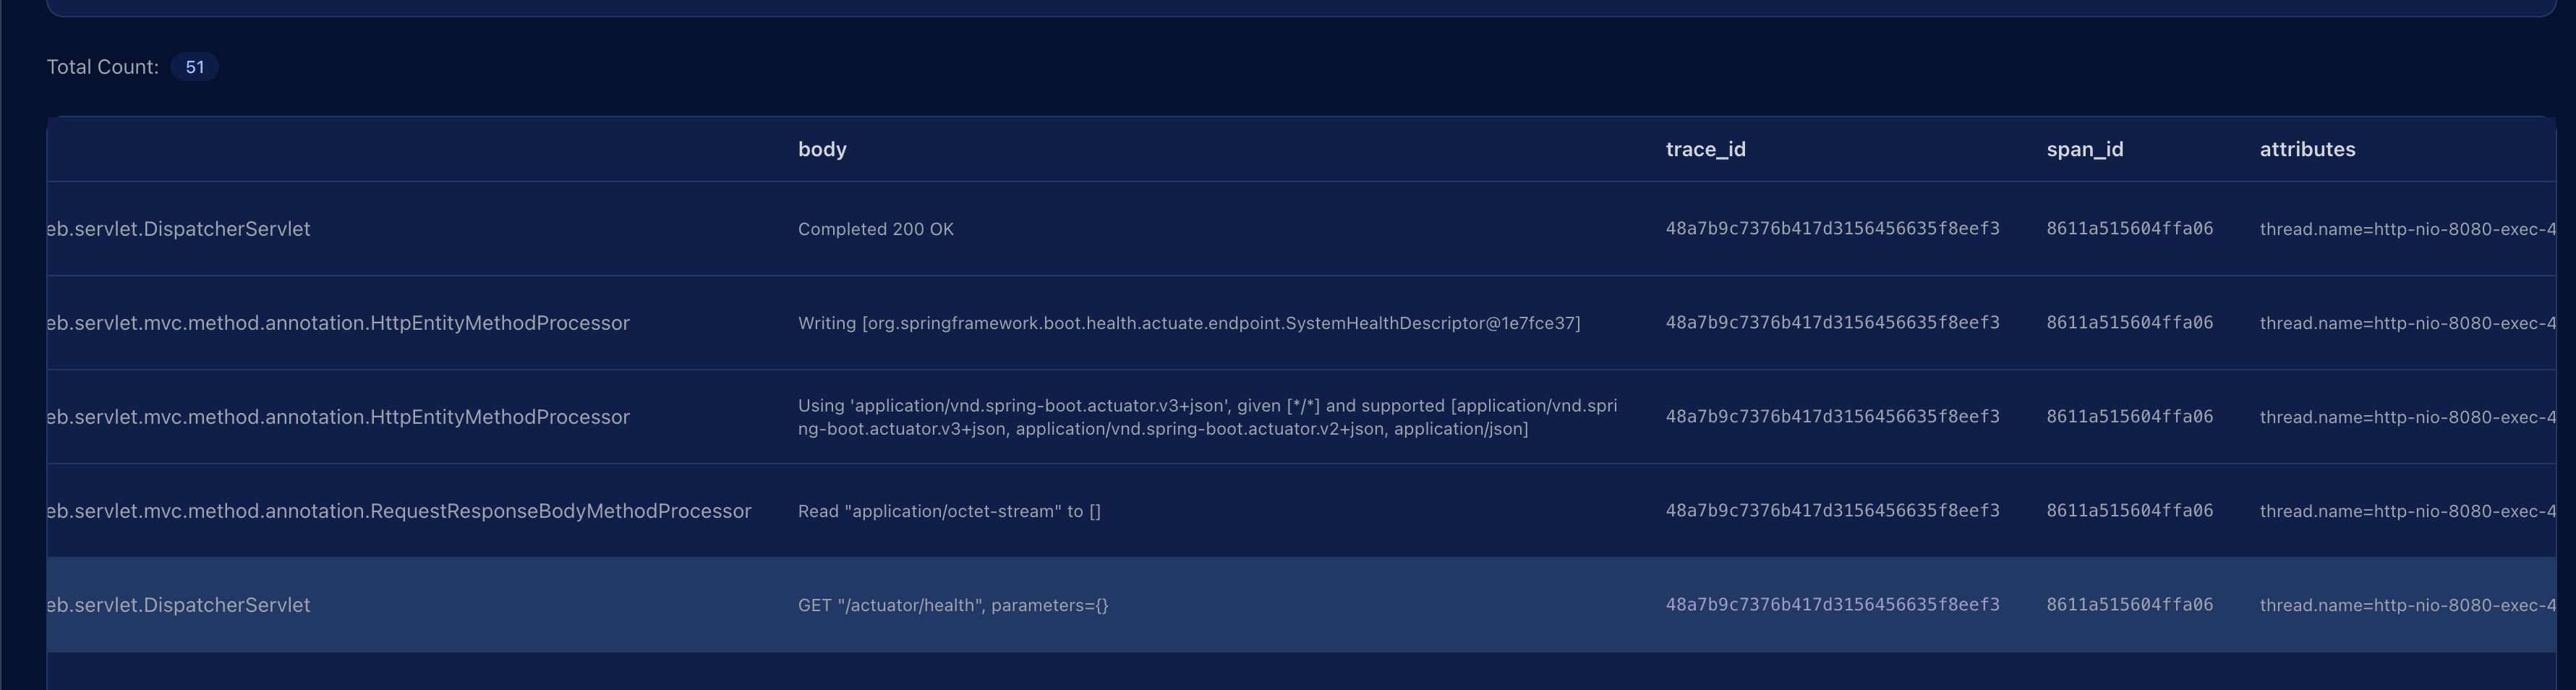
次のコマンドでHTTP リクエストを送信します:
```bash
curl http://localhost:8080/actuator/health
```
再度、"View Logs"を押すと、リクエストログが出力され、`trace_id` 列に対応する Trace ID が確認できます。
---
本記事では、LognrollをOTLP エンドポイントとしてローカルに立ち上げ、Spring Boot アプリケーションから OpenTelemetry Logback Appender を介してログを送信しました。
`otel-logs-autoconfigure` が提供する Auto Configuration により、`logback‑spring.xml` を手書きせずに `application.properties` だけで設定が完結します。