---
title: Sending Spring Boot Application Logs with Logback + OpenTelemetry (OTLP)
summary: In this article, we introduce how to send logs from Spring Boot via OTLP using the alpha version of opentelemetry‑logback‑appender and a custom Auto‑Configuration, presenting a configuration procedure and implementation example that does not require a logback‑spring.xml.
tags: ["OpenTelemetry", "Spring Boot", "Lognroll", "Java", "Logging"]
categories: ["Programming", "Java", "org", "springframework", "boot"]
date: 2026-01-23T12:05:56.976Z
updated: 2026-01-23T12:05:56.976Z
---
If you want to send logs with Spring Boot + Logback via OTLP (OpenTelemetry Protocol), you can use the [opentelemetry‑logback‑appender](https://github.com/open-telemetry/opentelemetry-java-instrumentation/blob/main/instrumentation/logback/logback-appender-1.0/library).
The way to configure it in `logback‑spring.xml` is described in the blog ["OpenTelemetry with Spring Boot"](https://spring.io/blog/2025/11/18/opentelemetry-with-spring-boot). This appender is not a GA release; it is an alpha version that has been around for a long time. As long as it remains an alpha version, you cannot expect Spring Boot to provide Auto Configuration (there have actually been breaking changes. The `OpenTelemetry` object itself is auto‑configured).
That said, manually preparing a `logback‑spring.xml` each time is cumbersome. Therefore, I created the following Auto Configuration library and use it as a provisional support until the alpha appender becomes GA.
https://github.com/making/otel-logs-autoconfigure
This Auto Configuration works with both Spring Boot 3.5 series and 4 series, so I will introduce how to use it for each version in order.
### Preparing the OTLP Backend (Lognroll)
We use the lightweight Lognroll as the OTLP endpoint that receives logs.
The repository is https://github.com/categolj/lognroll.
You can start it with Docker as follows:
```bash
docker run --rm -p 4318:4318 ghcr.io/categolj/lognroll:native
```
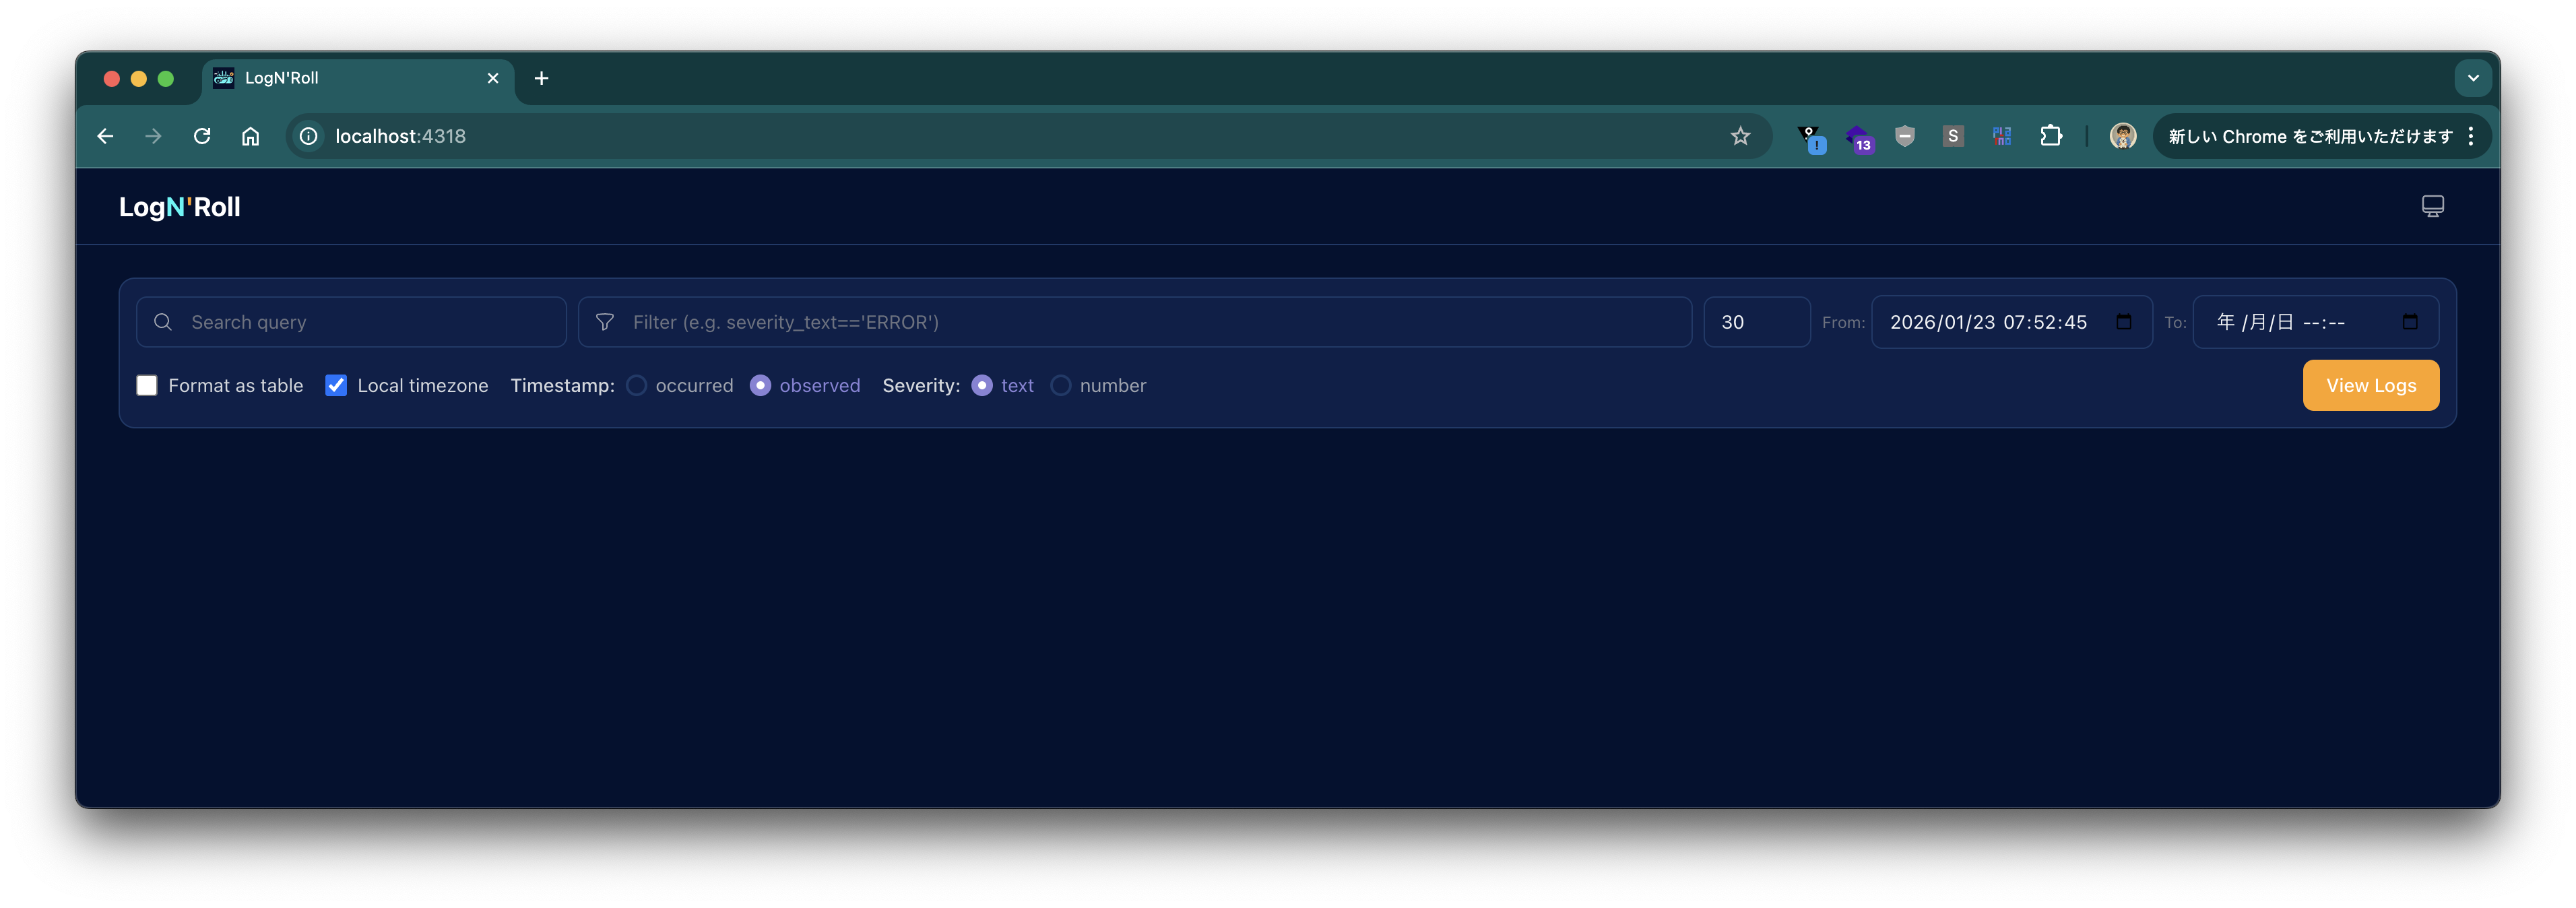
After it starts, access `http://localhost:4318` in a browser and log in with **username: (empty), password: `changeme`** to see the following screen.
### When Using Spring Boot 4+
Create a project with the following command:
```bash
curl -s https://start.spring.io/starter.tgz \
-d artifactId=demo-otel-logs \
-d name=demo-otel-logs \
-d baseDir=demo-otel-logs \
-d packageName=com.example \
-d dependencies=web,actuator,configuration-processor,prometheus,opentelemetry,native \
-d type=maven-project \
-d applicationName=DemoOtelLogsApplication | tar -xzvf -
cd demo-otel-logs
```
Add the following to `pom.xml`:
```xml
am.ik.spring.opentelemetry
otel-logs-autoconfigure
0.5.0
```
Add the following properties to `src/main/resources/application.properties`:
```properties
logging.level.web=debug
# Enable experimental attribute capture for OpenTelemetry Logback Appender
management.opentelemetry.instrumentation.logback-appender.capture-experimental-attributes=true
management.opentelemetry.instrumentation.logback-appender.capture-key-value-pair-attributes=true
# OTLP export destination
management.opentelemetry.logging.export.otlp.endpoint=http://localhost:4318/v1/logs
management.opentelemetry.logging.export.otlp.compression=gzip
management.opentelemetry.logging.export.otlp.headers.Authorization=Bearer changeme
# Disable metrics for this demo
management.otlp.metrics.export.enabled=false
```
### When Using Spring Boot 3.5
Create a project with the following command:
```bash
curl -s https://start.spring.io/starter.tgz \
-d artifactId=demo-otel-logs \
-d name=demo-otel-logs \
-d baseDir=demo-otel-logs \
-d packageName=com.example \
-d dependencies=web,actuator,configuration-processor,prometheus,native \
-d type=maven-project \
-d bootVersion=3.5.10 \
-d applicationName=DemoOtelLogsApplication | tar -xzvf -
cd demo-otel-logs
```
Since the Spring Boot 3.5 series does not provide a starter for OpenTelemetry, we also add Micrometer's bridge to integrate with Trace ID.
```xml
am.ik.spring.opentelemetry
otel-logs-autoconfigure
0.5.0
io.micrometer
micrometer-tracing-bridge-otel
```
Furthermore, the Logback Appender version used internally by `otel-logs-autoconfigure:0.5.0` does not work with the OpenTelemetry Java SDK version managed by Spring Boot 3.5. Therefore, add the following to the `` section of `pom.xml` to override the version:
```xml
1.55.0
```
The contents of `application.properties` differ from those for Spring Boot 4+ in the OTLP export destination properties.
```properties
logging.level.web=debug
# Enable experimental attribute capture for OpenTelemetry Logback Appender
management.opentelemetry.instrumentation.logback-appender.capture-experimental-attributes=true
management.opentelemetry.instrumentation.logback-appender.capture-key-value-pair-attributes=true
# OTLP export destination
management.otlp.logging.endpoint=http://localhost:4318/v1/logs
management.otlp.logging.compression=gzip
management.otlp.logging.headers.Authorization=Bearer changeme
# Disable metrics for this demo
management.otlp.metrics.export.enabled=false
```
### Build and Verification
Build with the following command:
```bash
./mvnw clean package -DskipTests
```
Run with:
```bash
java -jar target/demo-otel-logs-0.0.1-SNAPSHOT.jar
```
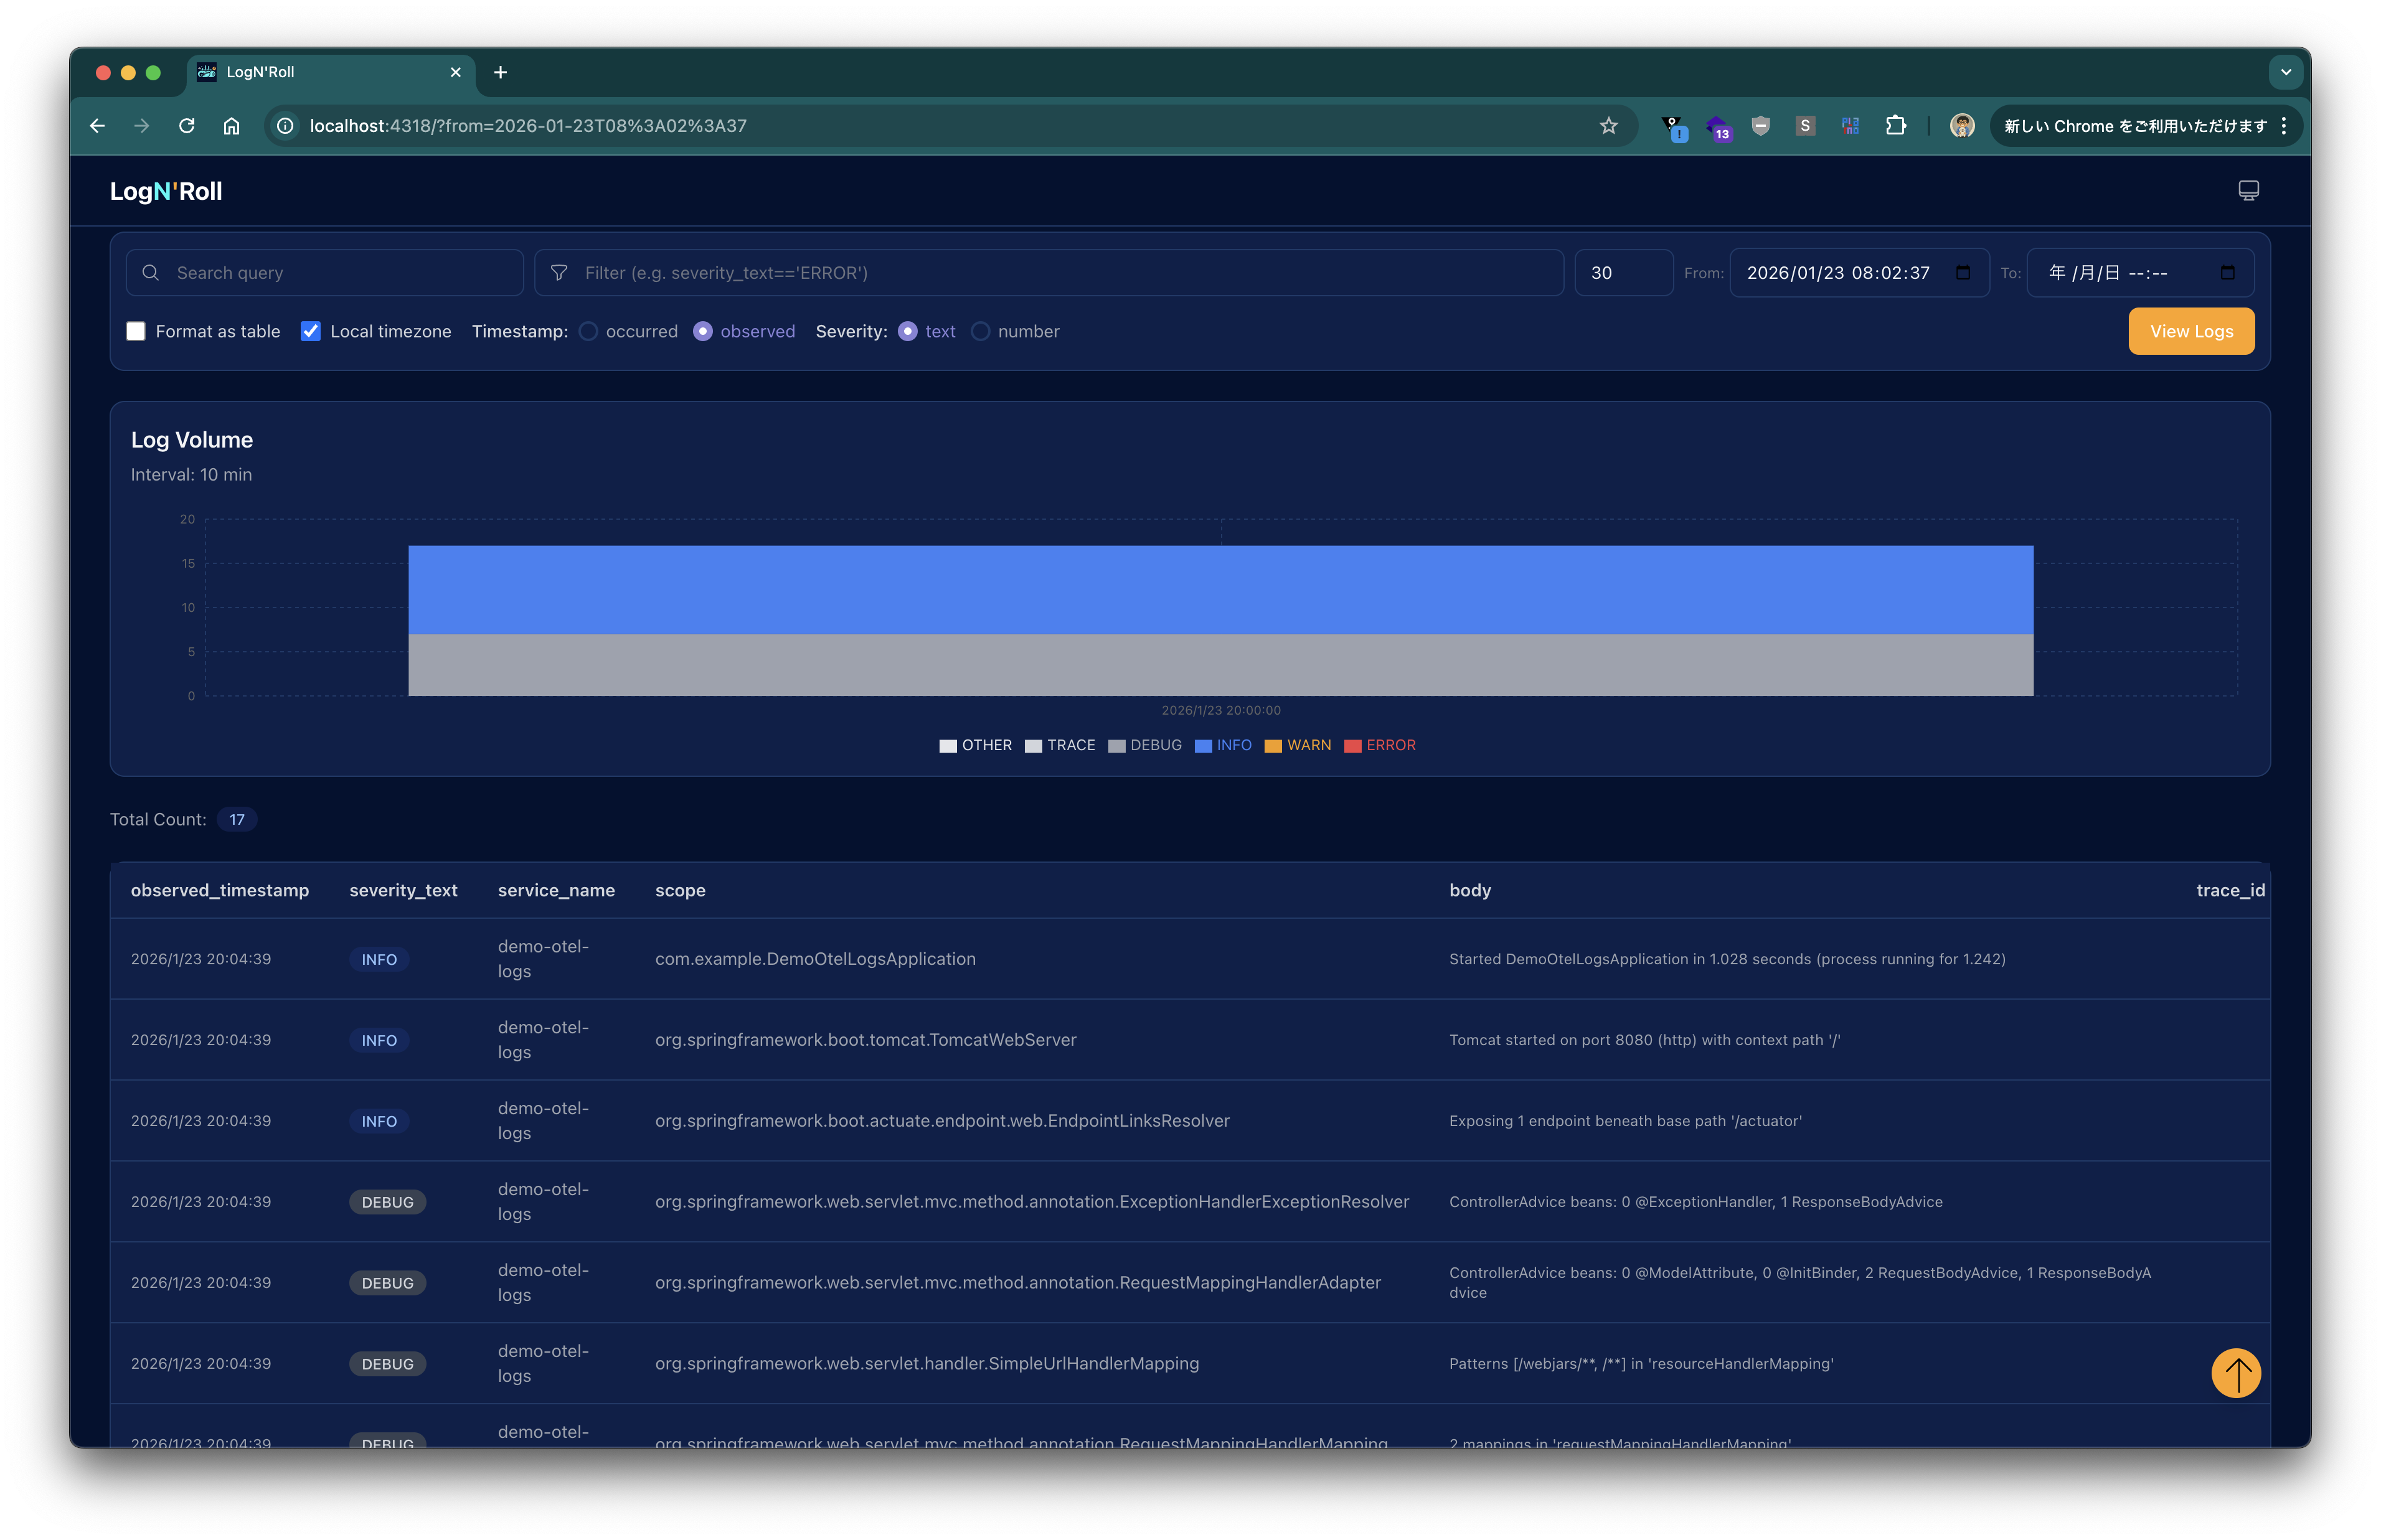
After the application starts, click the **View Logs** button in Lognroll’s UI to see logs displayed as shown below.
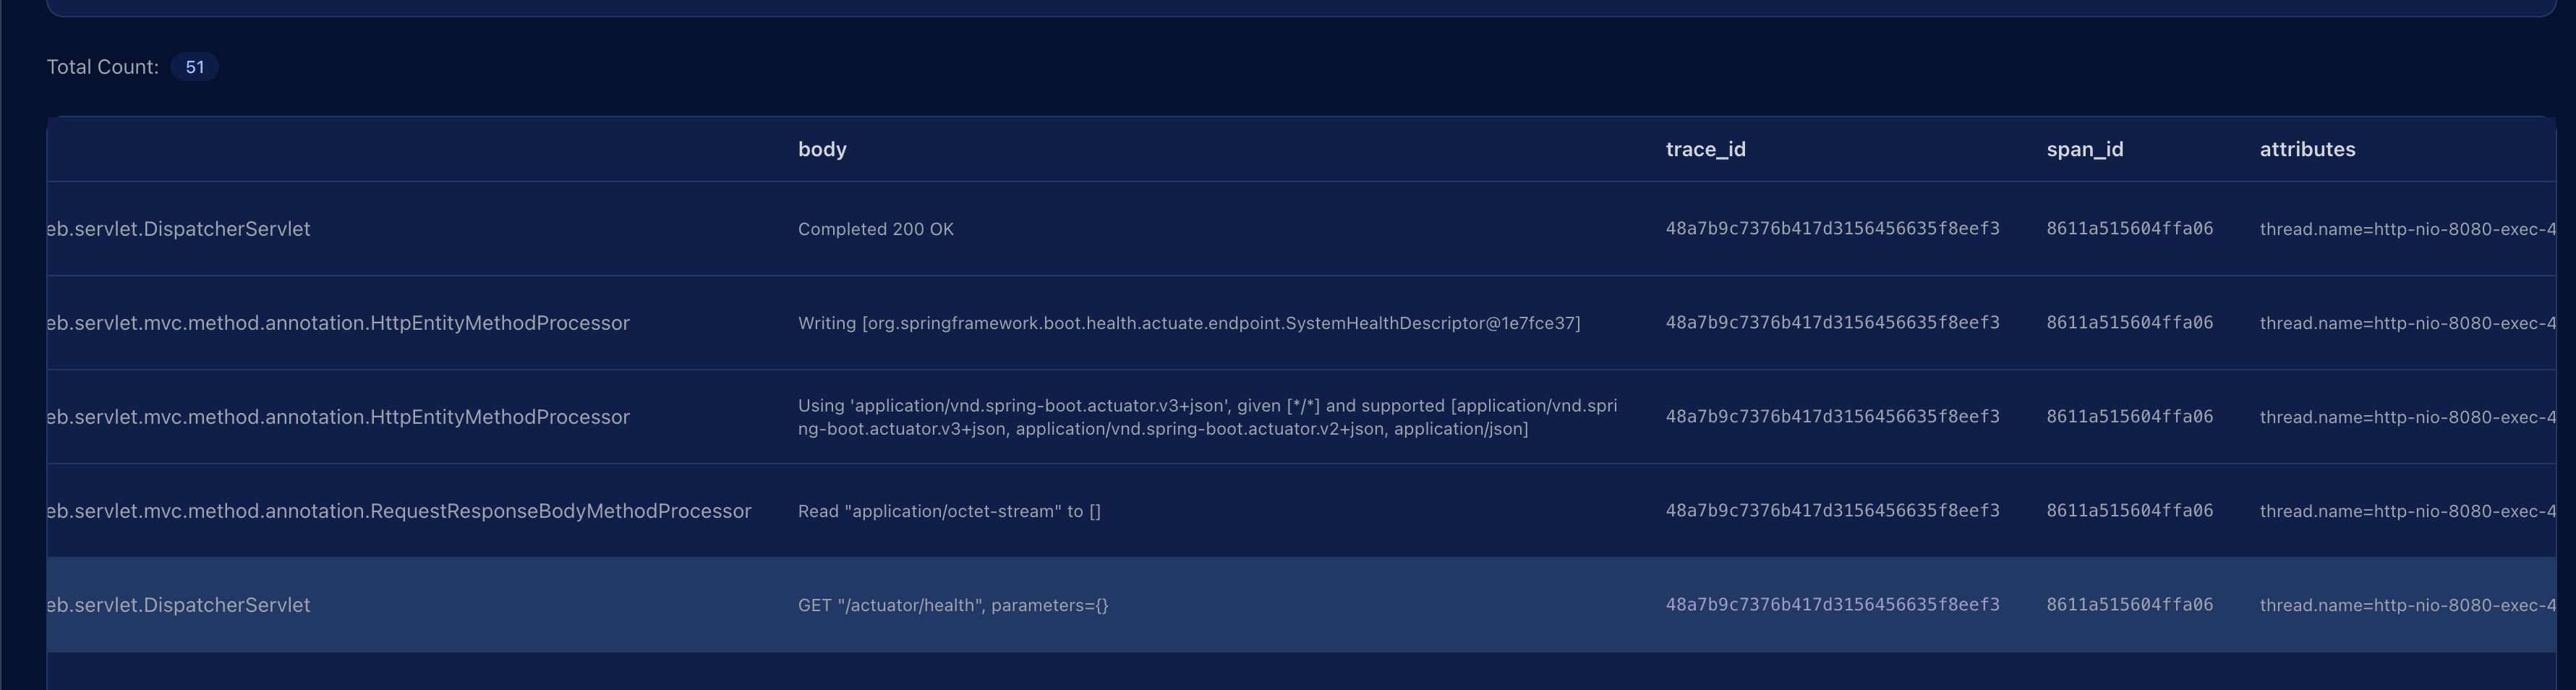
Send an HTTP request with:
```bash
curl http://localhost:8080/actuator/health
```
Press **View Logs** again; the request log appears, and the `trace_id` column shows the corresponding Trace ID.
---
In this article, we ran Lognroll locally as an OTLP endpoint and sent logs from a Spring Boot application via the OpenTelemetry Logback Appender.
Thanks to the Auto Configuration provided by `otel-logs-autoconfigure`, the setup is completed using only `application.properties` without having to write a `logback‑spring.xml`.