Sending Spring Boot Application Logs with Logback + OpenTelemetry (OTLP)
If you want to send logs with Spring Boot + Logback via OTLP (OpenTelemetry Protocol), you can use the opentelemetry‑logback‑appender.
The way to configure it in logback‑spring.xml is described in the blog "OpenTelemetry with Spring Boot". This appender is not a GA release; it is an alpha version that has been around for a long time. As long as it remains an alpha version, you cannot expect Spring Boot to provide Auto Configuration (there have actually been breaking changes. The OpenTelemetry object itself is auto‑configured).
That said, manually preparing a logback‑spring.xml each time is cumbersome. Therefore, I created the following Auto Configuration library and use it as a provisional support until the alpha appender becomes GA.
https://github.com/making/otel-logs-autoconfigure
This Auto Configuration works with both Spring Boot 3.5 series and 4 series, so I will introduce how to use it for each version in order.
Preparing the OTLP Backend (Lognroll)
We use the lightweight Lognroll as the OTLP endpoint that receives logs.
The repository is https://github.com/categolj/lognroll.
You can start it with Docker as follows:
docker run --rm -p 4318:4318 ghcr.io/categolj/lognroll:native
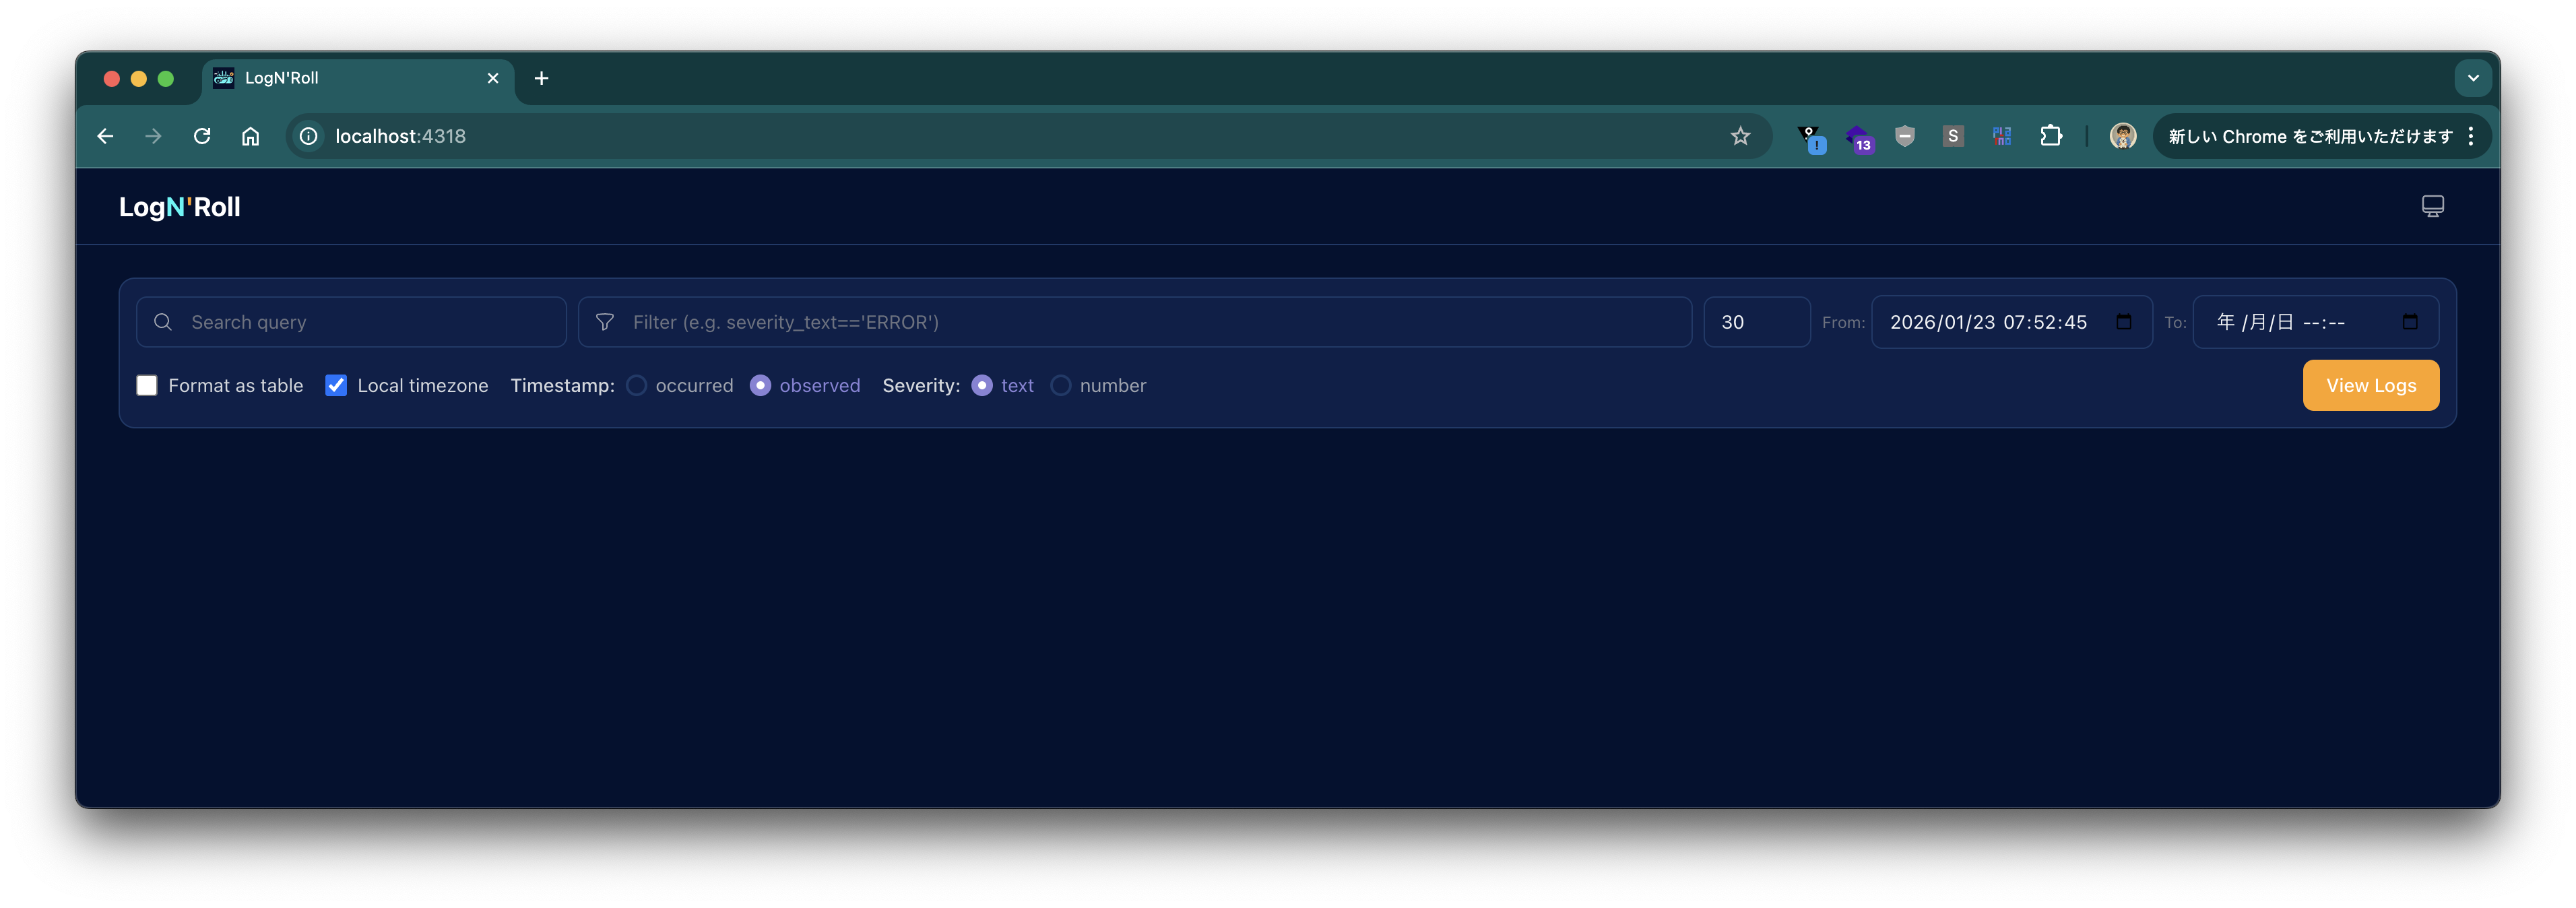
After it starts, access http://localhost:4318 in a browser and log in with username: (empty), password: changeme to see the following screen.
When Using Spring Boot 4+
Create a project with the following command:
curl -s https://start.spring.io/starter.tgz \
       -d artifactId=demo-otel-logs \
       -d name=demo-otel-logs \
       -d baseDir=demo-otel-logs \
       -d packageName=com.example \
       -d dependencies=web,actuator,configuration-processor,prometheus,opentelemetry,native \
       -d type=maven-project \
       -d applicationName=DemoOtelLogsApplication | tar -xzvf -
cd demo-otel-logs
Add the following to pom.xml:
<dependency>
    <groupId>am.ik.spring.opentelemetry</groupId>
    <artifactId>otel-logs-autoconfigure</artifactId>
    <version>0.5.0</version>
</dependency>
Add the following properties to src/main/resources/application.properties:
logging.level.web=debug

# Enable experimental attribute capture for OpenTelemetry Logback Appender
management.opentelemetry.instrumentation.logback-appender.capture-experimental-attributes=true
management.opentelemetry.instrumentation.logback-appender.capture-key-value-pair-attributes=true

# OTLP export destination
management.opentelemetry.logging.export.otlp.endpoint=http://localhost:4318/v1/logs
management.opentelemetry.logging.export.otlp.compression=gzip
management.opentelemetry.logging.export.otlp.headers.Authorization=Bearer changeme

# Disable metrics for this demo
management.otlp.metrics.export.enabled=false
When Using Spring Boot 3.5
Create a project with the following command:
curl -s https://start.spring.io/starter.tgz \
       -d artifactId=demo-otel-logs \
       -d name=demo-otel-logs \
       -d baseDir=demo-otel-logs \
       -d packageName=com.example \
       -d dependencies=web,actuator,configuration-processor,prometheus,native \
       -d type=maven-project \
       -d bootVersion=3.5.10 \
       -d applicationName=DemoOtelLogsApplication | tar -xzvf -
cd demo-otel-logs
Since the Spring Boot 3.5 series does not provide a starter for OpenTelemetry, we also add Micrometer's bridge to integrate with Trace ID.
<dependency>
    <groupId>am.ik.spring.opentelemetry</groupId>
    <artifactId>otel-logs-autoconfigure</artifactId>
    <version>0.5.0</version>
</dependency>

<dependency>
    <groupId>io.micrometer</groupId>
    <artifactId>micrometer-tracing-bridge-otel</artifactId>
</dependency>
Furthermore, the Logback Appender version used internally by otel-logs-autoconfigure:0.5.0 does not work with the OpenTelemetry Java SDK version managed by Spring Boot 3.5. Therefore, add the following to the <properties> section of pom.xml to override the version:
<properties>
    <!-- ... -->
    <opentelemetry.version>1.55.0</opentelemetry.version>
</properties>
The contents of application.properties differ from those for Spring Boot 4+ in the OTLP export destination properties.
logging.level.web=debug

# Enable experimental attribute capture for OpenTelemetry Logback Appender
management.opentelemetry.instrumentation.logback-appender.capture-experimental-attributes=true
management.opentelemetry.instrumentation.logback-appender.capture-key-value-pair-attributes=true

# OTLP export destination
management.otlp.logging.endpoint=http://localhost:4318/v1/logs
management.otlp.logging.compression=gzip
management.otlp.logging.headers.Authorization=Bearer changeme

# Disable metrics for this demo
management.otlp.metrics.export.enabled=false
Build and Verification
Build with the following command:
./mvnw clean package -DskipTests
Run with:
java -jar target/demo-otel-logs-0.0.1-SNAPSHOT.jar
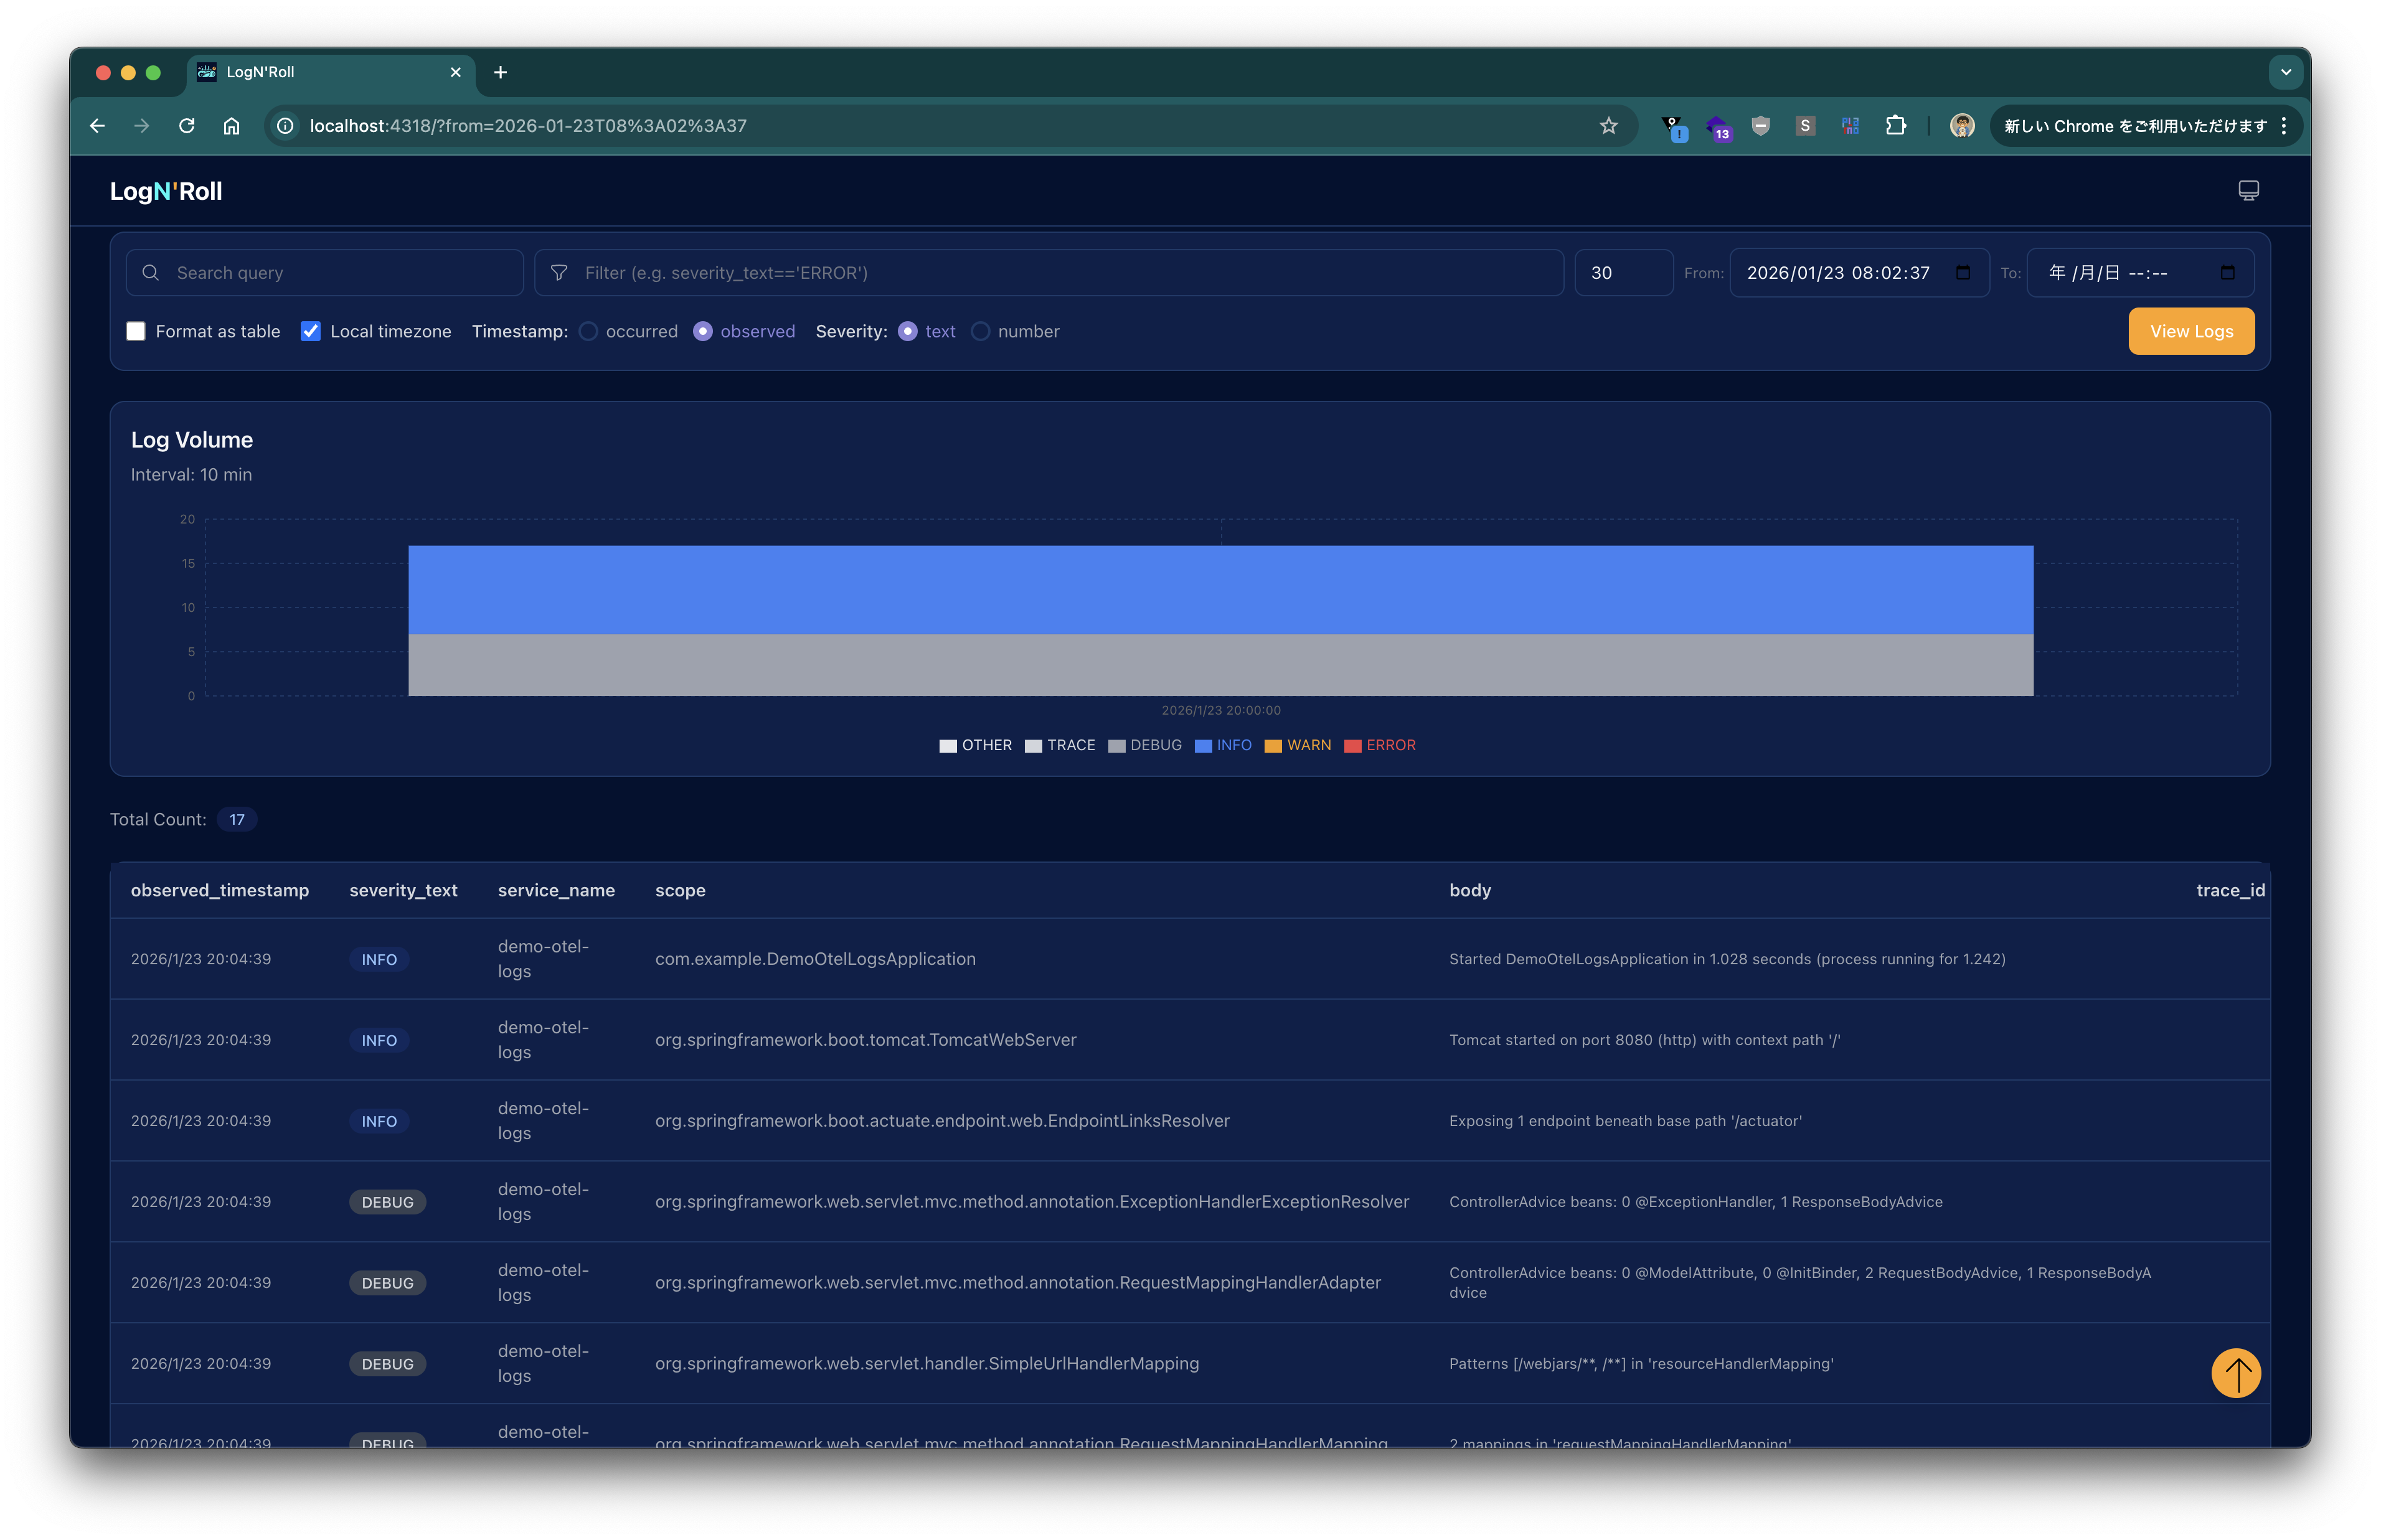
After the application starts, click the View Logs button in Lognroll’s UI to see logs displayed as shown below.
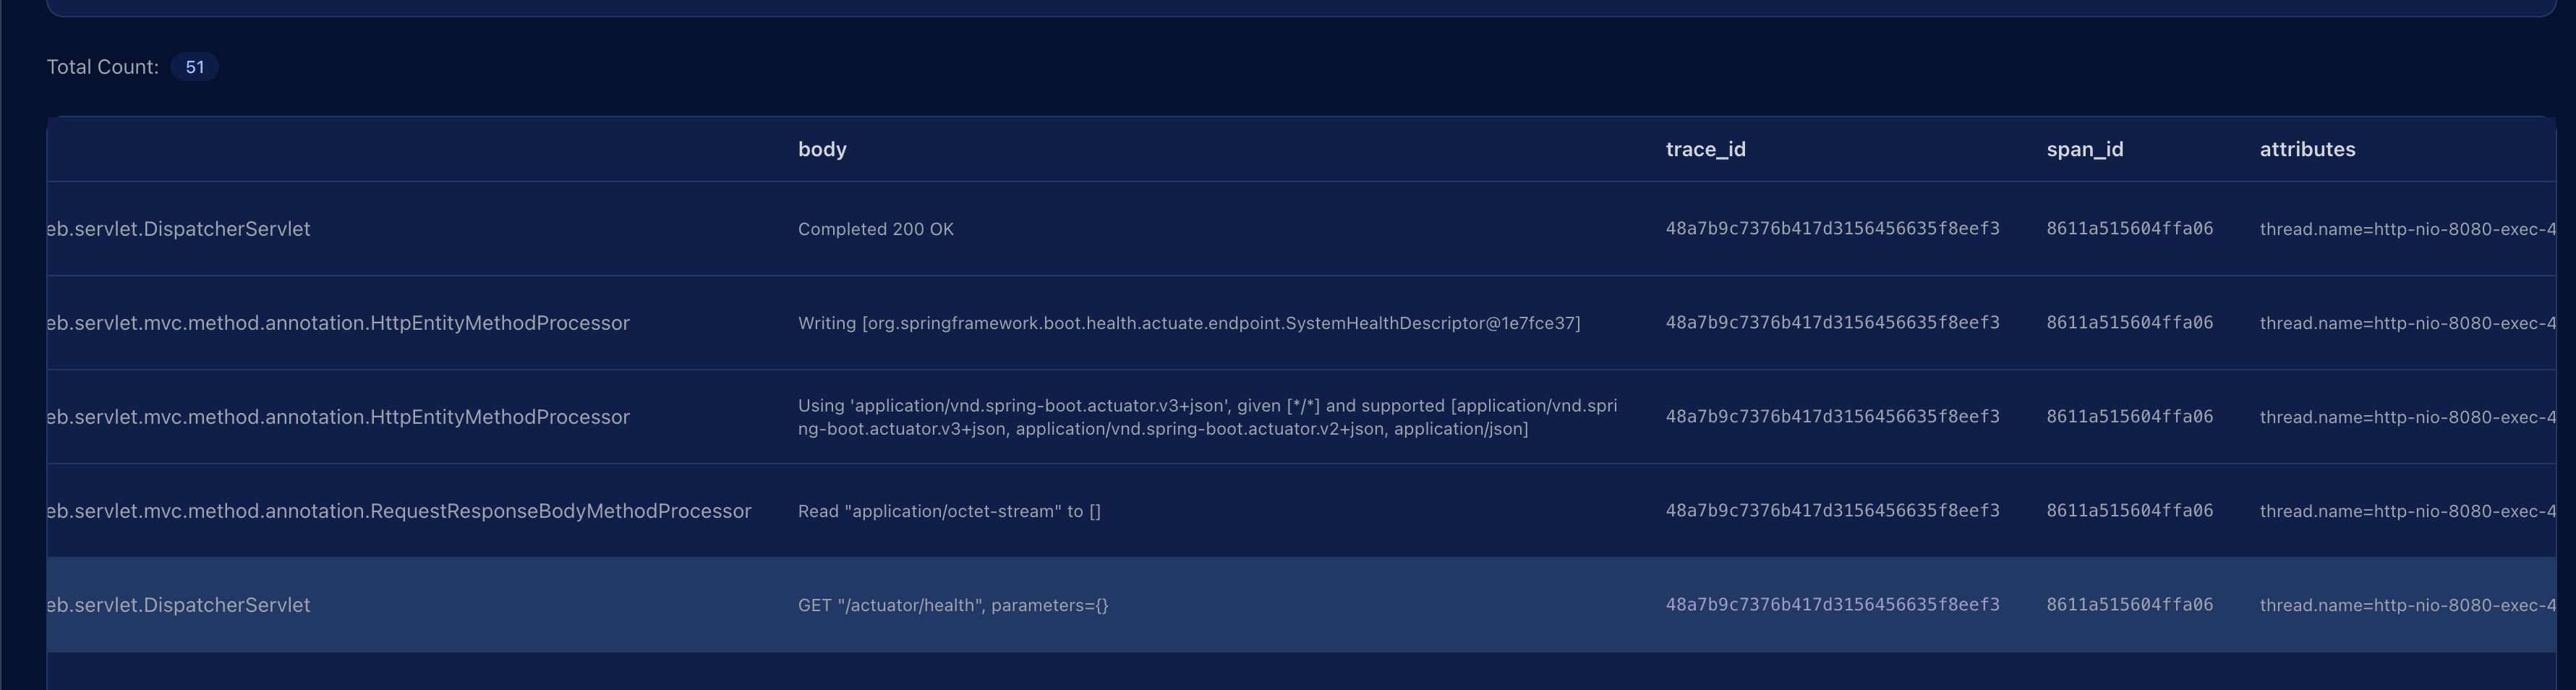
Send an HTTP request with:
curl http://localhost:8080/actuator/health
Press View Logs again; the request log appears, and the trace_id column shows the corresponding Trace ID.
In this article, we ran Lognroll locally as an OTLP endpoint and sent logs from a Spring Boot application via the OpenTelemetry Logback Appender.
Thanks to the Auto Configuration provided by otel-logs-autoconfigure, the setup is completed using only application.properties without having to write a logback‑spring.xml.