Instrumenting JDBC Operations in Spring Boot Applications with Datasource Micrometer
Note
2026-02-04 Added explanation of datasource-micrometer-opentelemetry.
Datasource Micrometer (documentation link) is a JDBC proxy that records JDBC operations with Micrometer’s Observation API, enhancing observability. In addition to traces and metrics, it can capture SQL logs and slow‑query logs. Although it is now developed independently of Micrometer, it is still closely aligned with Micrometer.
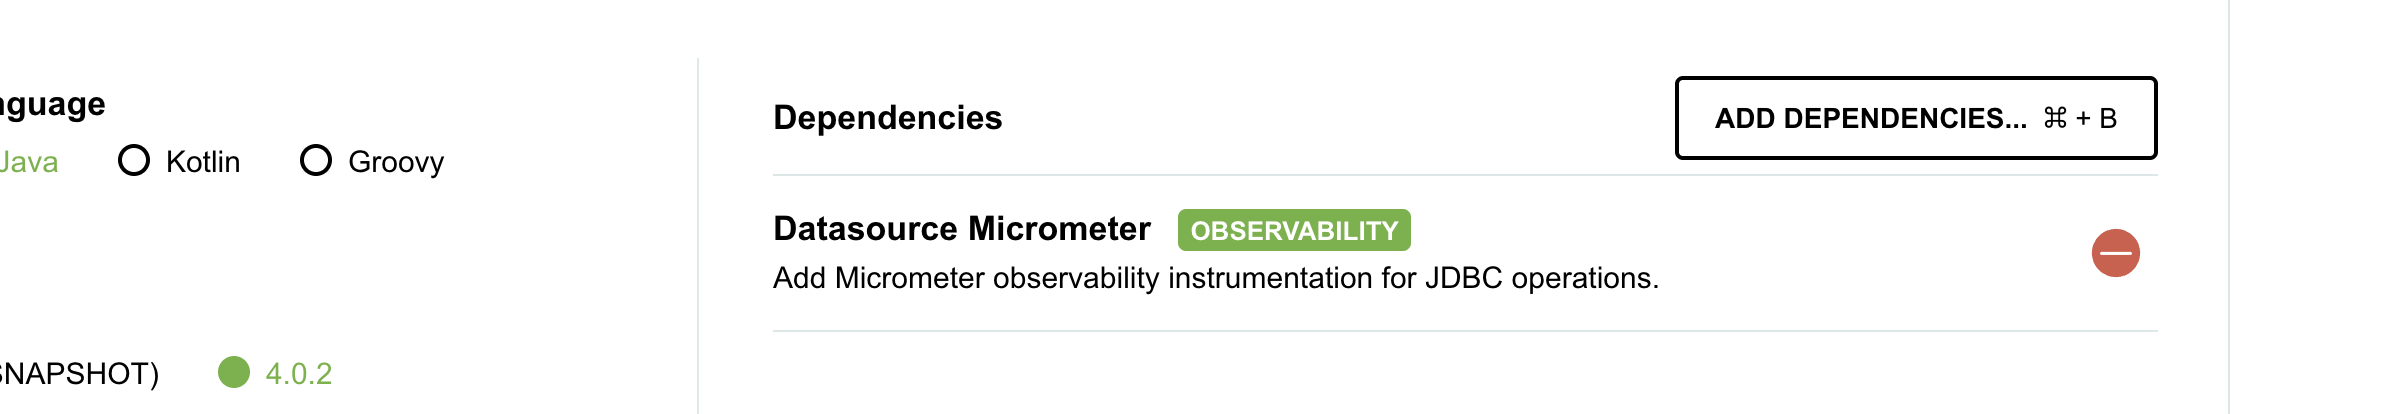
Since the end of 2025, Datasource Micrometer can be selected directly from Spring Initializr, making it easy to use. Datasource Micrometer 1.x works with Spring Boot 3.5, while Datasource Micrometer 2.x works with Spring Boot 4.
For the sample application, we’ll create a simple Counter API. Generate a project skeleton with the following command:
curl -s https://start.spring.io/starter.tgz \
       -d artifactId=counter-api\
       -d name=counter-api \
       -d baseDir=counter-api \
       -d packageName=com.example \
       -d dependencies=web,jdbc,postgresql,actuator,configuration-processor,opentelemetry,datasource-micrometer,testcontainers \
       -d type=maven-project \
       -d applicationName=CounterApiApplication | tar -xzvf -
cd counter-api
The Datasource Micrometer dependency is already added. Compared with a project that does not include datasource-micrometer in dependencies, the following settings are added:
30a31
> 		<datasource-micrometer.version>2.1.0</datasource-micrometer.version>
48a50,57
> 		<dependency>
> 			<groupId>net.ttddyy.observation</groupId>
> 			<artifactId>datasource-micrometer-opentelemetry</artifactId>
> 		</dependency>
> 		<dependency>
> 			<groupId>net.ttddyy.observation</groupId>
> 			<artifactId>datasource-micrometer-spring-boot</artifactId>
> 		</dependency>
95a105,115
> 	<dependencyManagement>
> 		<dependencies>
> 			<dependency>
> 				<groupId>net.ttddyy.observation</groupId>
> 				<artifactId>datasource-micrometer-bom</artifactId>
> 				<version>${datasource-micrometer.version}</version>
> 				<type>pom</type>
> 				<scope>import</scope>
> 			</dependency>
> 		</dependencies>
> 	</dependencyManagement>
When opentelemetry is also listed in dependencies, datasource-micrometer-opentelemetry is added automatically.
Since we’re already here, let’s also add the OpenTelemetry Logback Appender AutoConfiguration described in this article.
<dependency>
    <groupId>am.ik.spring.opentelemetry</groupId>
    <artifactId>otel-logs-autoconfigure</artifactId>
    <version>0.5.0</version>
</dependency>
Implement a simple API.
cat <<EOF > src/main/java/com/example/CounterController.java
package com.example;

import java.util.List;

import org.slf4j.Logger;
import org.slf4j.LoggerFactory;
import org.springframework.jdbc.core.simple.JdbcClient;
import org.springframework.transaction.annotation.Transactional;
import org.springframework.web.bind.annotation.GetMapping;
import org.springframework.web.bind.annotation.PostMapping;
import org.springframework.web.bind.annotation.RequestBody;
import org.springframework.web.bind.annotation.RestController;

@RestController
public class CounterController {

	private final JdbcClient jdbcClient;

	private final Logger logger = LoggerFactory.getLogger(this.getClass());

	public CounterController(JdbcClient jdbcClient) {
		this.jdbcClient = jdbcClient;
	}

	@PostMapping(path = "/counter")
	@Transactional
	public CounterResponse increment(@RequestBody CounterRequest request) {
		CounterResponse counterResponse = this.jdbcClient.sql("""
				INSERT INTO counters (entry_id, counter)
				VALUES (?, 1)
				ON CONFLICT (entry_id)
				DO UPDATE
				  SET counter = counters.counter + 1
				RETURNING entry_id, counter
				""").param(request.entryId()).query(CounterResponse.class).single();
		logger.atInfo()
			.addKeyValue("entryId", counterResponse.entryId())
			.addKeyValue("counter", counterResponse.counter())
			.log("event=increment entryId={} counter={}", counterResponse.entryId(), counterResponse.counter());
		return counterResponse;
	}

	@GetMapping(path = "/counter")
	public List<CounterResponse> getAll() {
		return this.jdbcClient.sql("""
				SELECT entry_id, counter FROM counters ORDER BY counter DESC
				""").query(CounterResponse.class).list();
	}

	public record CounterRequest(int entryId) {
	}

	public record CounterResponse(int entryId, long counter) {
	}

}
EOF
Configure application.properties. Set up SQL logging and slow‑query logging for Datasource Micrometer.
cat <<EOF >> src/main/resources/application.properties
jdbc.datasource-proxy.json-format=true
jdbc.datasource-proxy.logging=slf4j
jdbc.datasource-proxy.multiline=false
jdbc.datasource-proxy.query.enable-logging=true
jdbc.datasource-proxy.slow-query.enable-logging=true
jdbc.datasource-proxy.slow-query.threshold=5
logging.level.net.ttddyy.dsproxy.listener.logging.SLF4JQueryLoggingListener=debug
management.opentelemetry.instrumentation.logback-appender.capture-experimental-attributes=true
management.opentelemetry.instrumentation.logback-appender.capture-key-value-pair-attributes=true
management.otlp.metrics.export.base-time-unit=seconds
management.otlp.metrics.export.step=30s
management.tracing.sampling.probability=1.0
spring.sql.init.mode=always
EOF
Define a simple schema.
cat <<EOF > src/main/resources/schema.sql
CREATE TABLE IF NOT EXISTS counters
(
    entry_id BIGINT PRIMARY KEY,
    counter  BIGINT NOT NULL
);
EOF
Running the following command starts a PostgreSQL container via Testcontainers and a local development container for the LGTM stack. (Check src/test/java/com/example/TestcontainersConfiguration.java for details.) DataSource configuration and the OTLP endpoint are set up automatically.
./mvnw spring-boot:test-run
When the application starts, logs similar to the following appear, showing the Grafana URL.
2026-01-26T13:08:41.512+09:00  INFO 28654 --- [counter-api] [           main] [                                                 ] tc.grafana/otel-lgtm:latest              : Creating container for image: grafana/otel-lgtm:latest
2026-01-26T13:08:41.579+09:00  INFO 28654 --- [counter-api] [           main] [                                                 ] tc.grafana/otel-lgtm:latest              : Container grafana/otel-lgtm:latest is starting: e0bb34b52593b45152a1236b6766c8ba2b1d3949b5ade2f4126dfbe8bf681790
2026-01-26T13:08:46.762+09:00  INFO 28654 --- [counter-api] [           main] [                                                 ] tc.grafana/otel-lgtm:latest              : Container grafana/otel-lgtm:latest started in PT5.249929S
2026-01-26T13:08:46.762+09:00  INFO 28654 --- [counter-api] [           main] [                                                 ] o.t.grafana.LgtmStackContainer           : Access to the Grafana dashboard: http://localhost:35507
2026-01-26T13:08:46.862+09:00  INFO 28654 --- [counter-api] [           main] [                                                 ] i.m.c.instrument.push.PushMeterRegistry  : Publishing metrics for OtlpMeterRegistry every 30s to http://localhost:35511/v1/metrics with resource attributes {service.name=counter-api}
Send a couple of requests.
curl -s http://localhost:8080/counter --json '{"entryId":100}'
curl -s http://localhost:8080/counter
You’ll see SQL logs like the following.
2026-01-26T14:11:44.165+09:00 DEBUG 28654 --- [counter-api] [nio-8080-exec-1] [382b35f274086c23f3a45d4c94cfb785-6c507dd2b93e2c20] n.t.d.l.l.SLF4JQueryLoggingListener      : {"name":"test", "connection":4, "time":2, "success":true, "type":"Prepared", "batch":false, "querySize":1, "batchSize":0, "query":["INSERT INTO counters (entry_id, counter)\nVALUES (?, 1)\nON CONFLICT (entry_id)\nDO UPDATE\n  SET counter = counters.counter + 1\nRETURNING entry_id, counter\n"], "params":[["100"]]}
2026-01-26T14:11:44.169+09:00  INFO 28654 --- [counter-api] [nio-8080-exec-1] [382b35f274086c23f3a45d4c94cfb785-25067aeeaad66229] com.example.CounterController            : event=increment entryId=100 counter=1
2026-01-26T14:11:45.923+09:00 DEBUG 28654 --- [counter-api] [nio-8080-exec-3] [1a250337750c5fbed850028f8fe5c636-72c7abbd0c14e831] n.t.d.l.l.SLF4JQueryLoggingListener      : {"name":"test", "connection":5, "time":0, "success":true, "type":"Prepared", "batch":false, "querySize":1, "batchSize":0, "query":["SELECT entry_id, counter FROM counters ORDER BY counter DESC\n"], "params":[[]]}
Next, apply load with vegeta.
for round in $(seq 20); do
  echo "=== Round $round/20 ==="
  for i in $(seq 3000); do
    id=$((RANDOM % 50 + 1))
    if [ $((RANDOM % 3)) -eq 0 ]; then
      echo '{"method":"GET","url":"http://localhost:8080/counter"}'
    else
      echo '{"method":"POST","url":"http://localhost:8080/counter","header":{"Content-Type":["application/json"]},"body":"'$(echo -n "{\"entryId\":$id}" | base64)'"}'
    fi
  done | vegeta attack -rate=100 -duration=30s -format=json | vegeta report
done
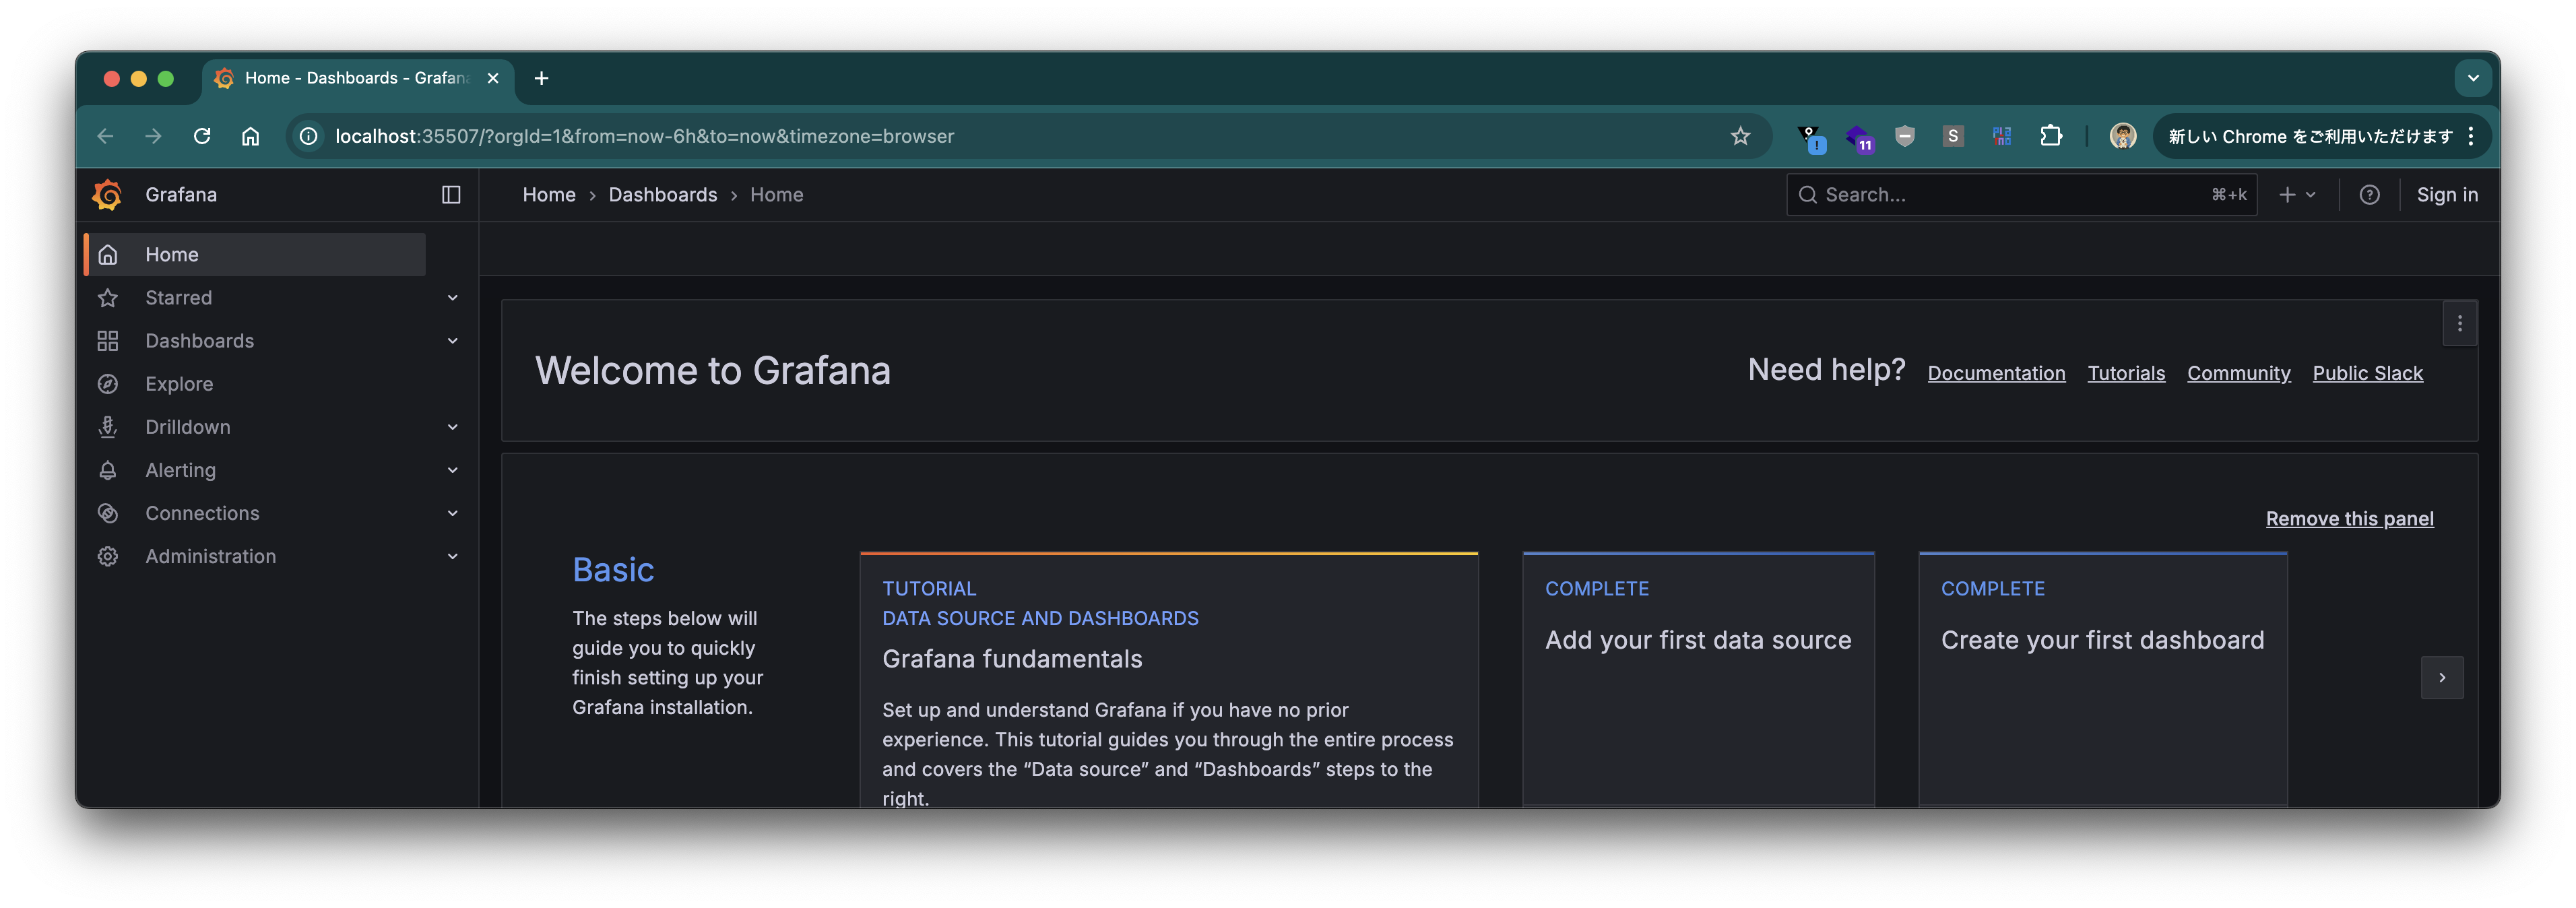
Verify in Grafana
Open Grafana. The URL is printed in the logs.
Traces
From the left‑hand menu, select "Traces" under Drilldown.
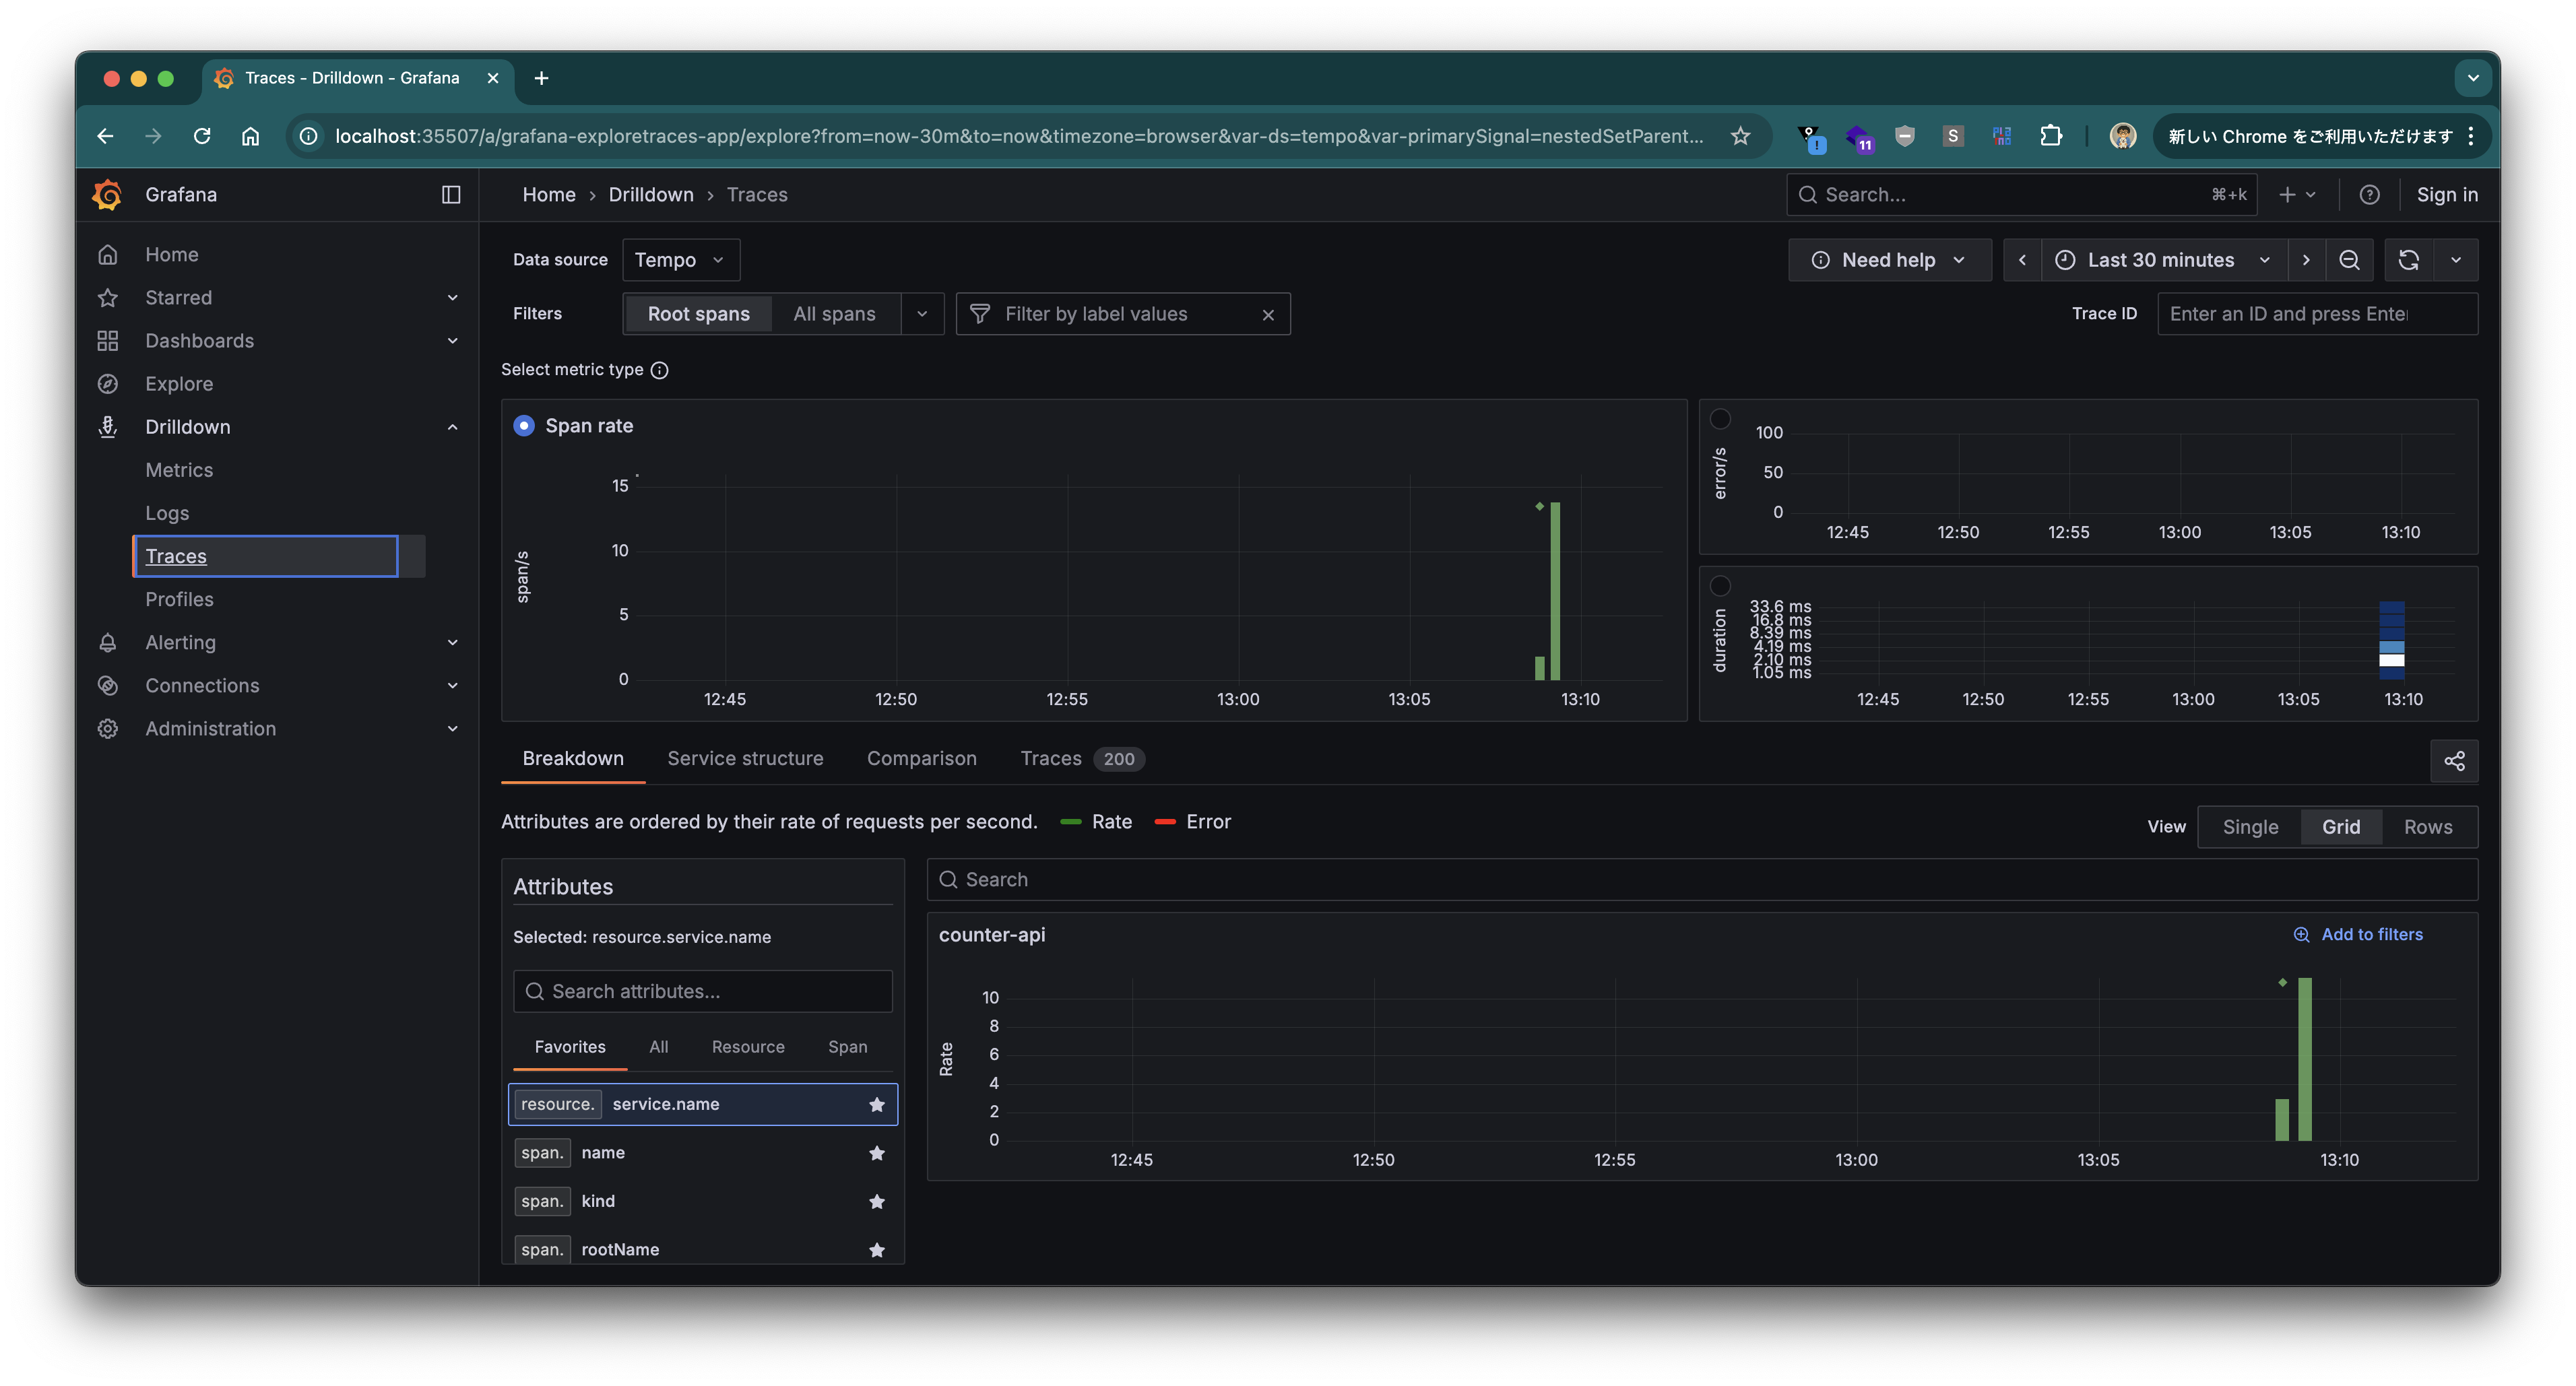
Click the ◇ marker (Exemplar) on the Span Rate chart, then click "View trace".
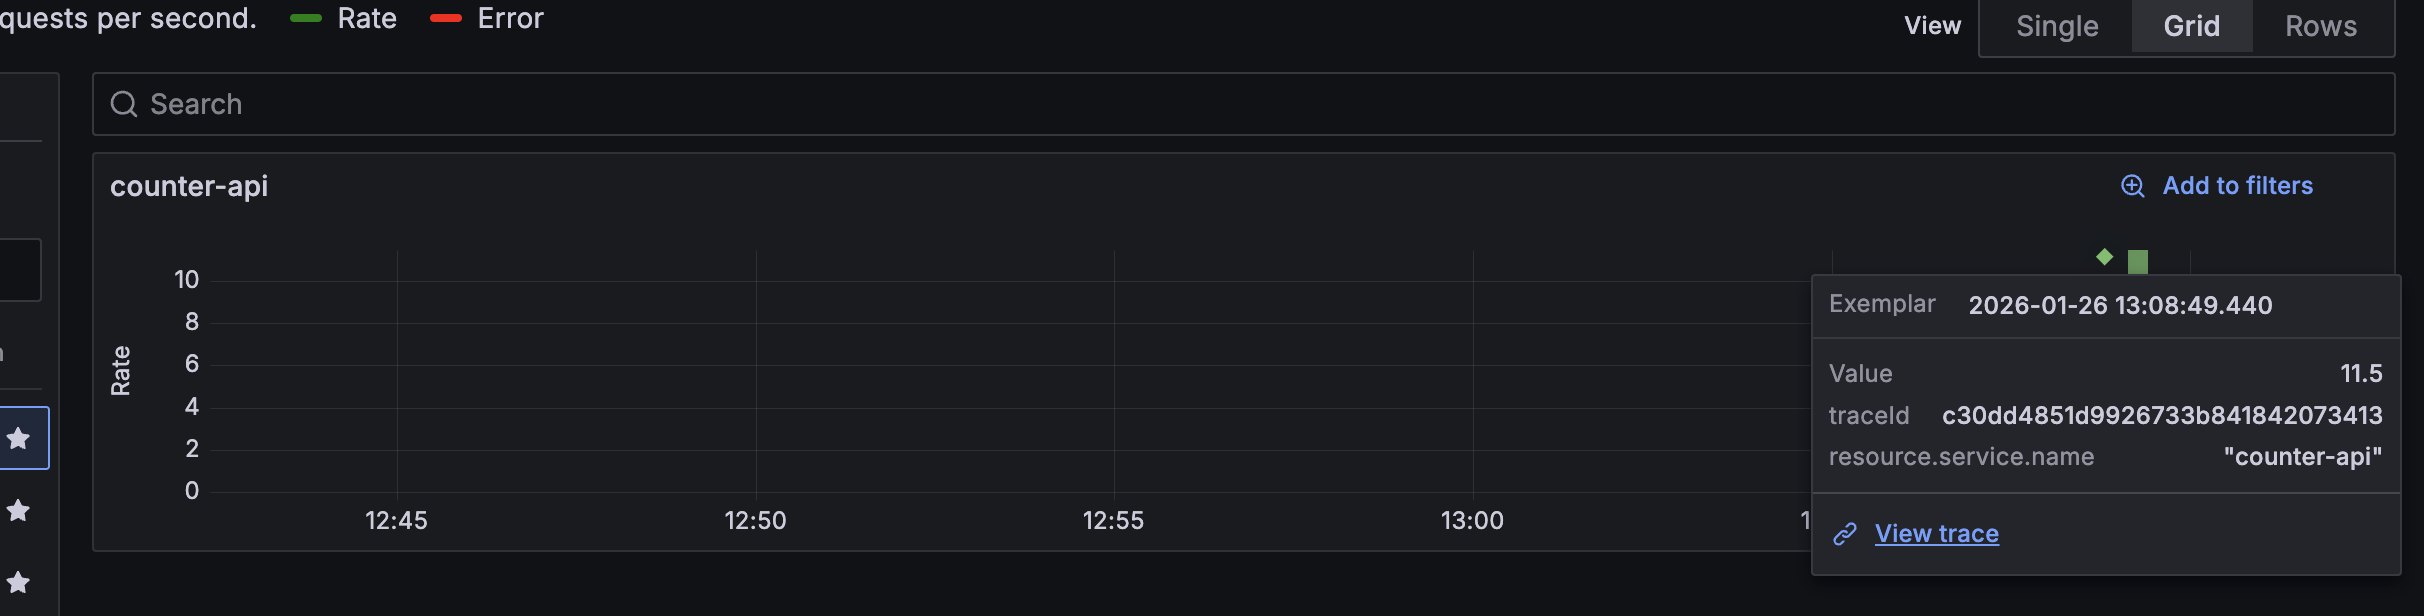
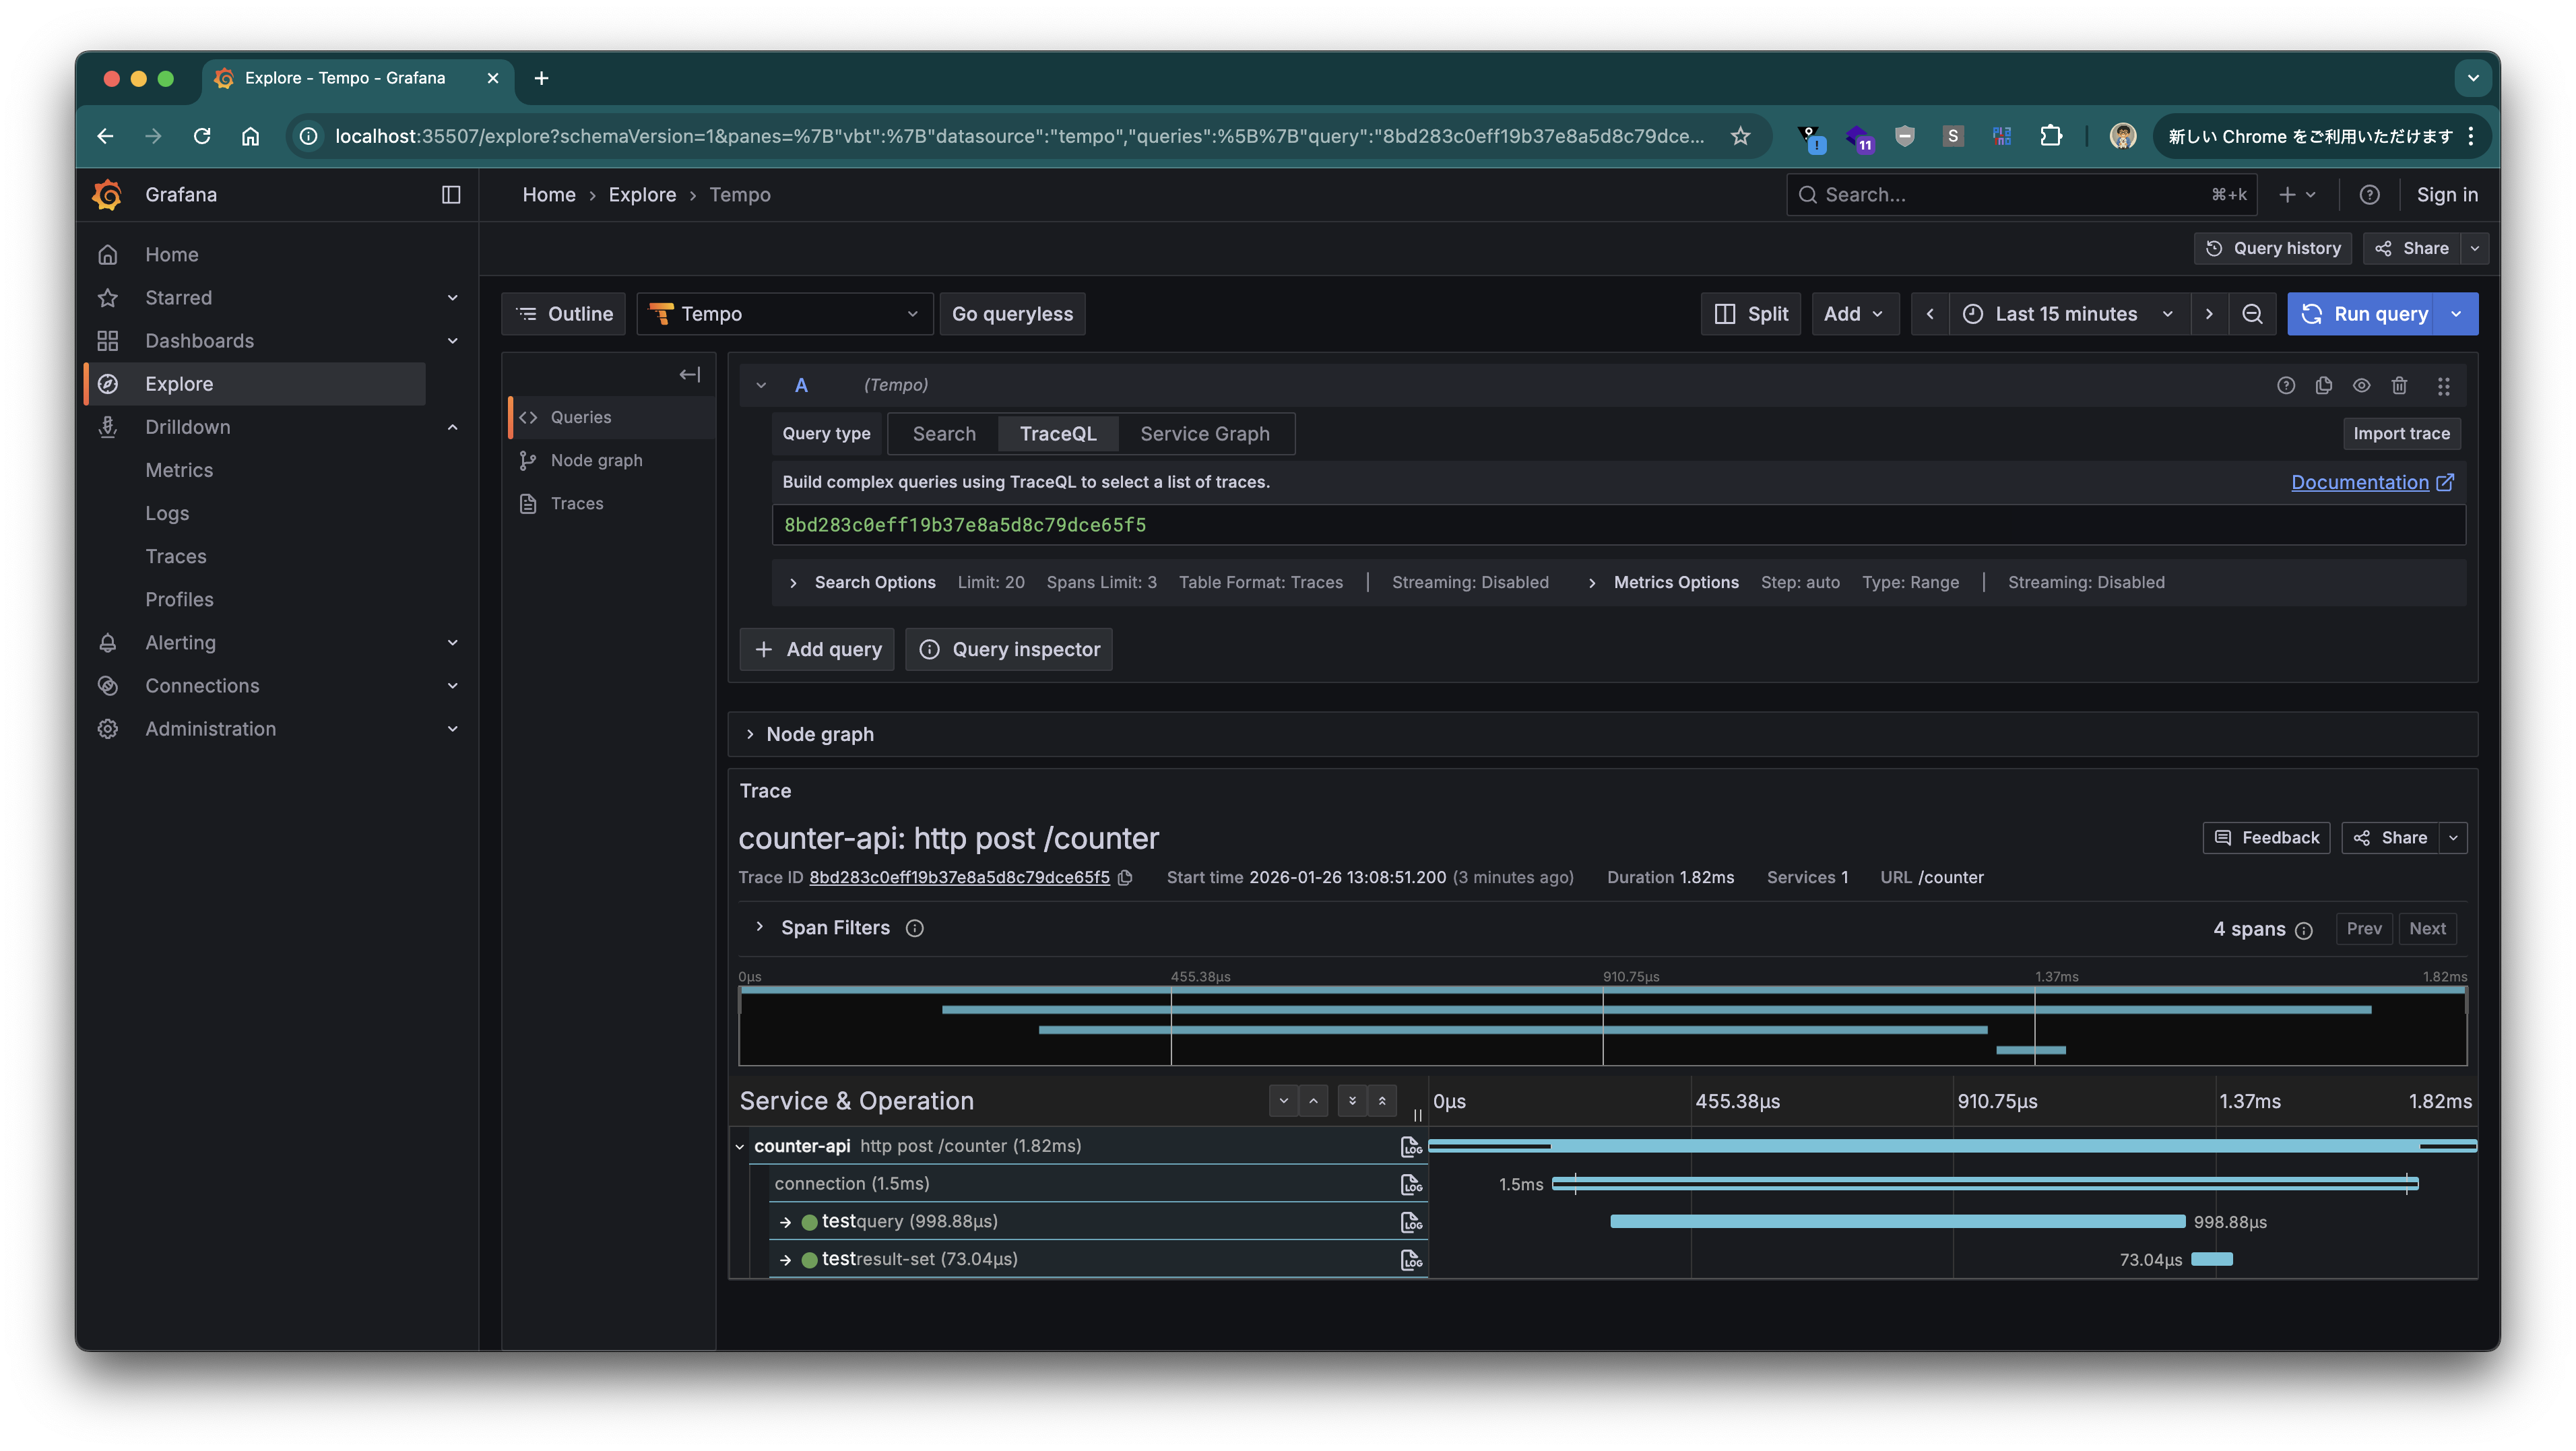
The Trace View for that request is displayed.
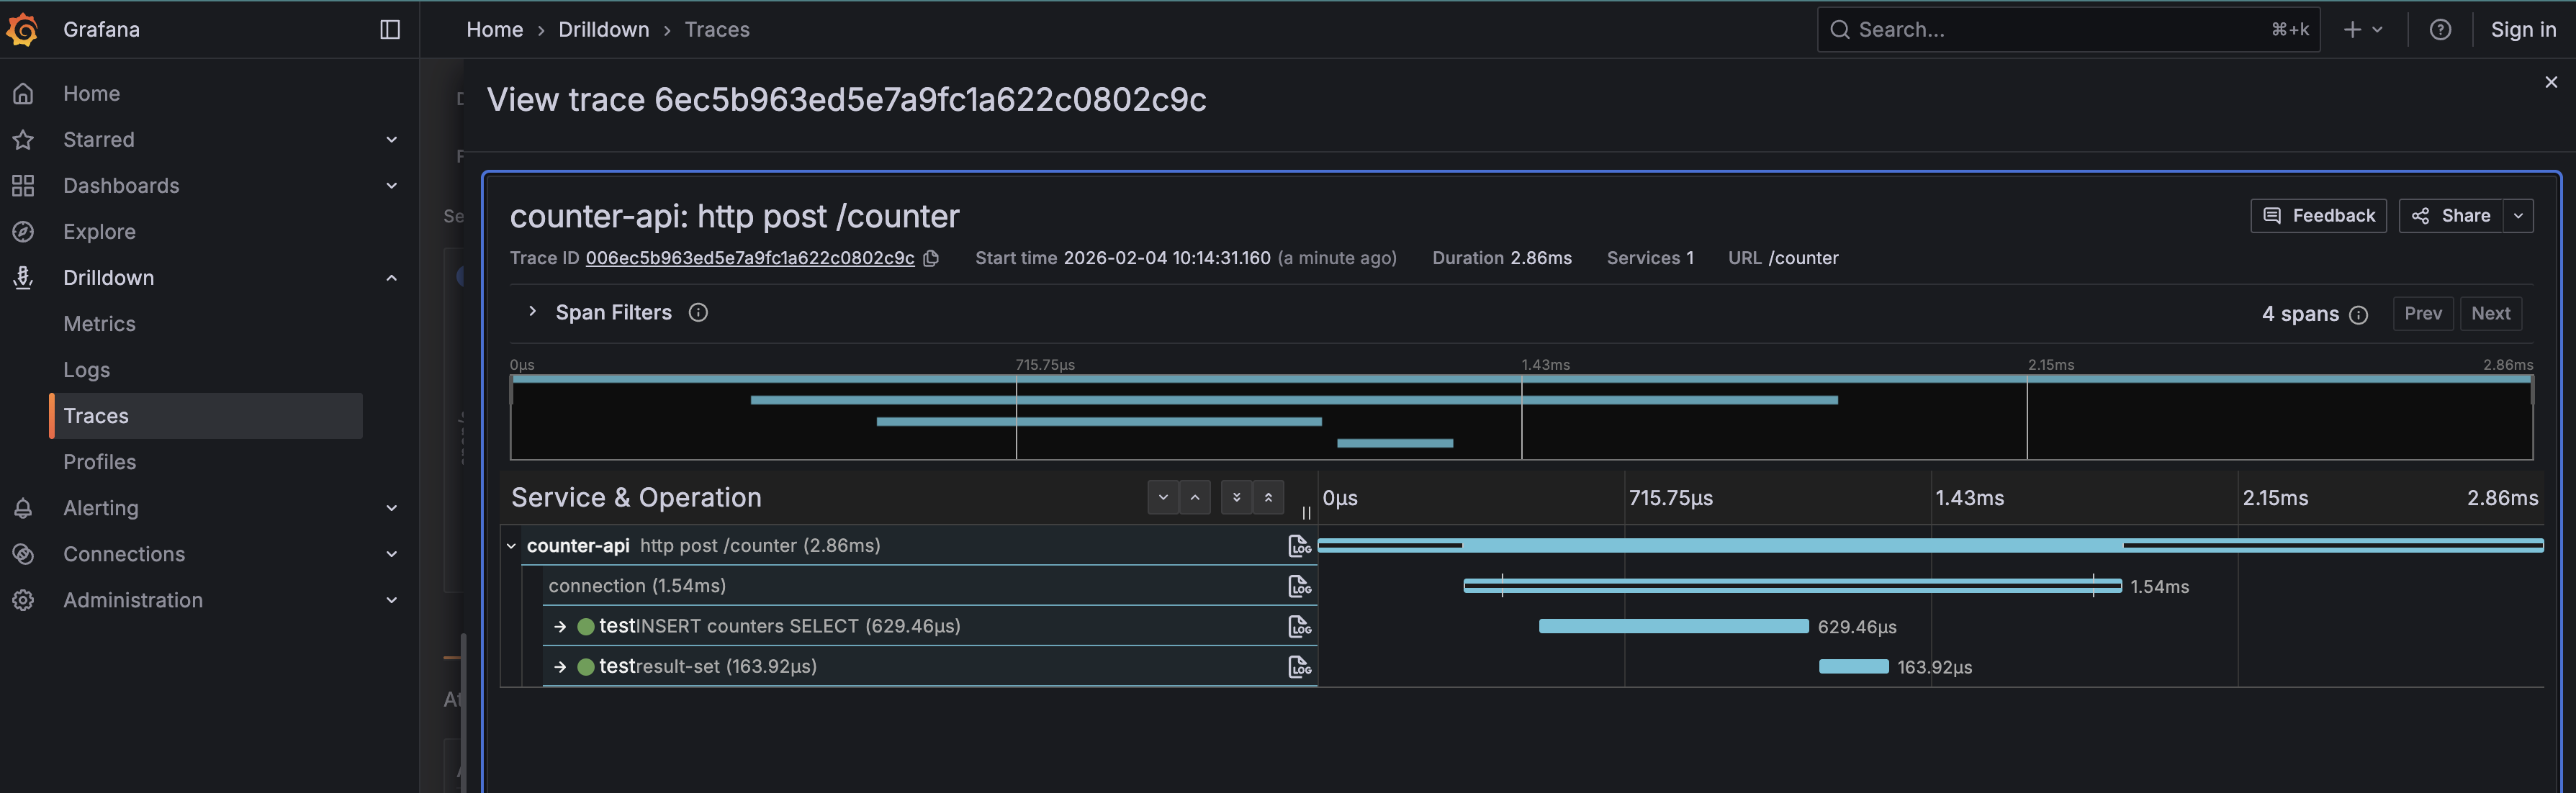
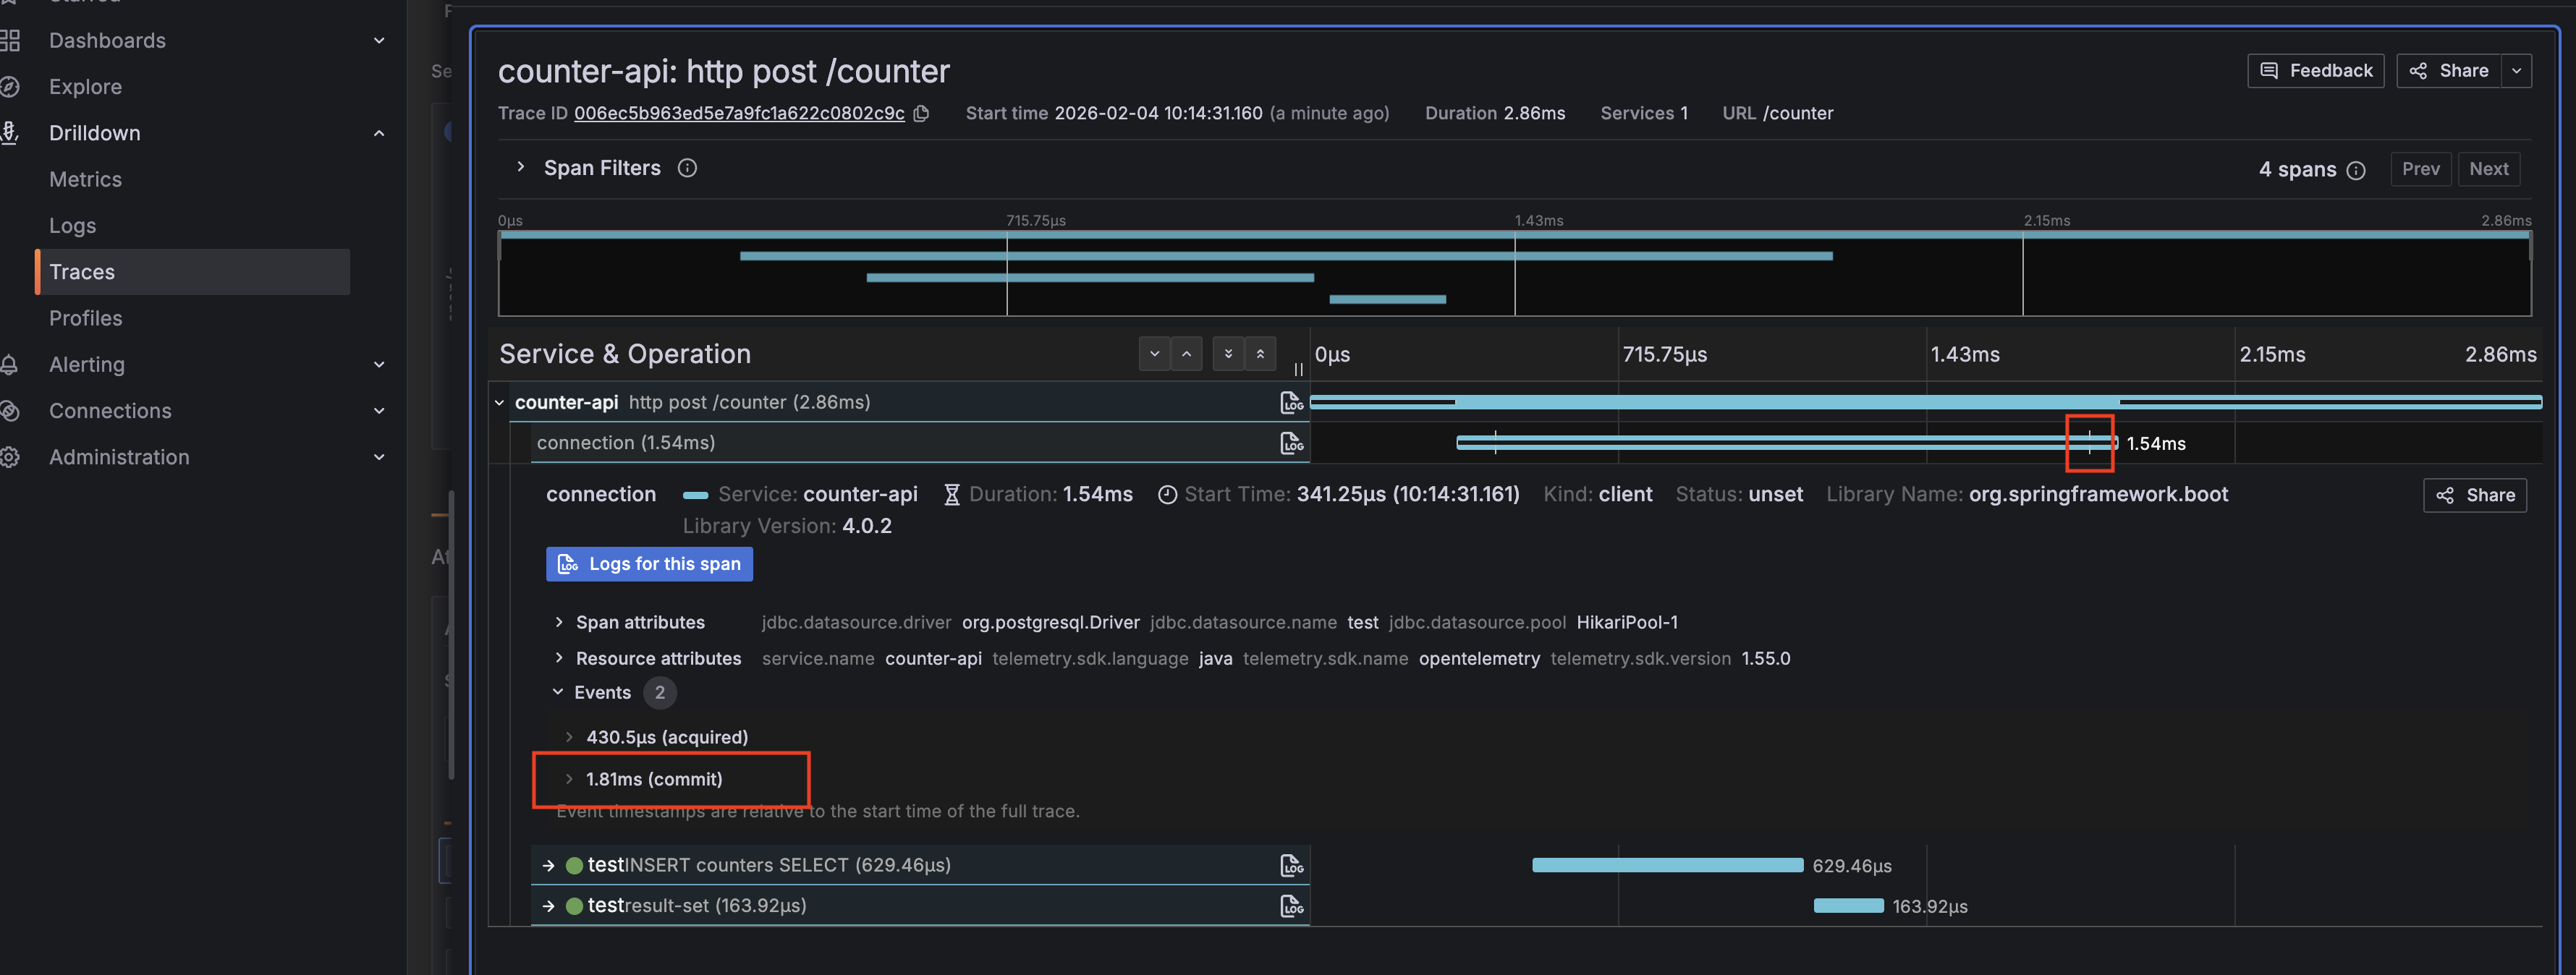
Click the "connection" span to see commit timings, counts, and durations.
Click the "INSERT …" span to view the exact SQL that was executed at that moment.
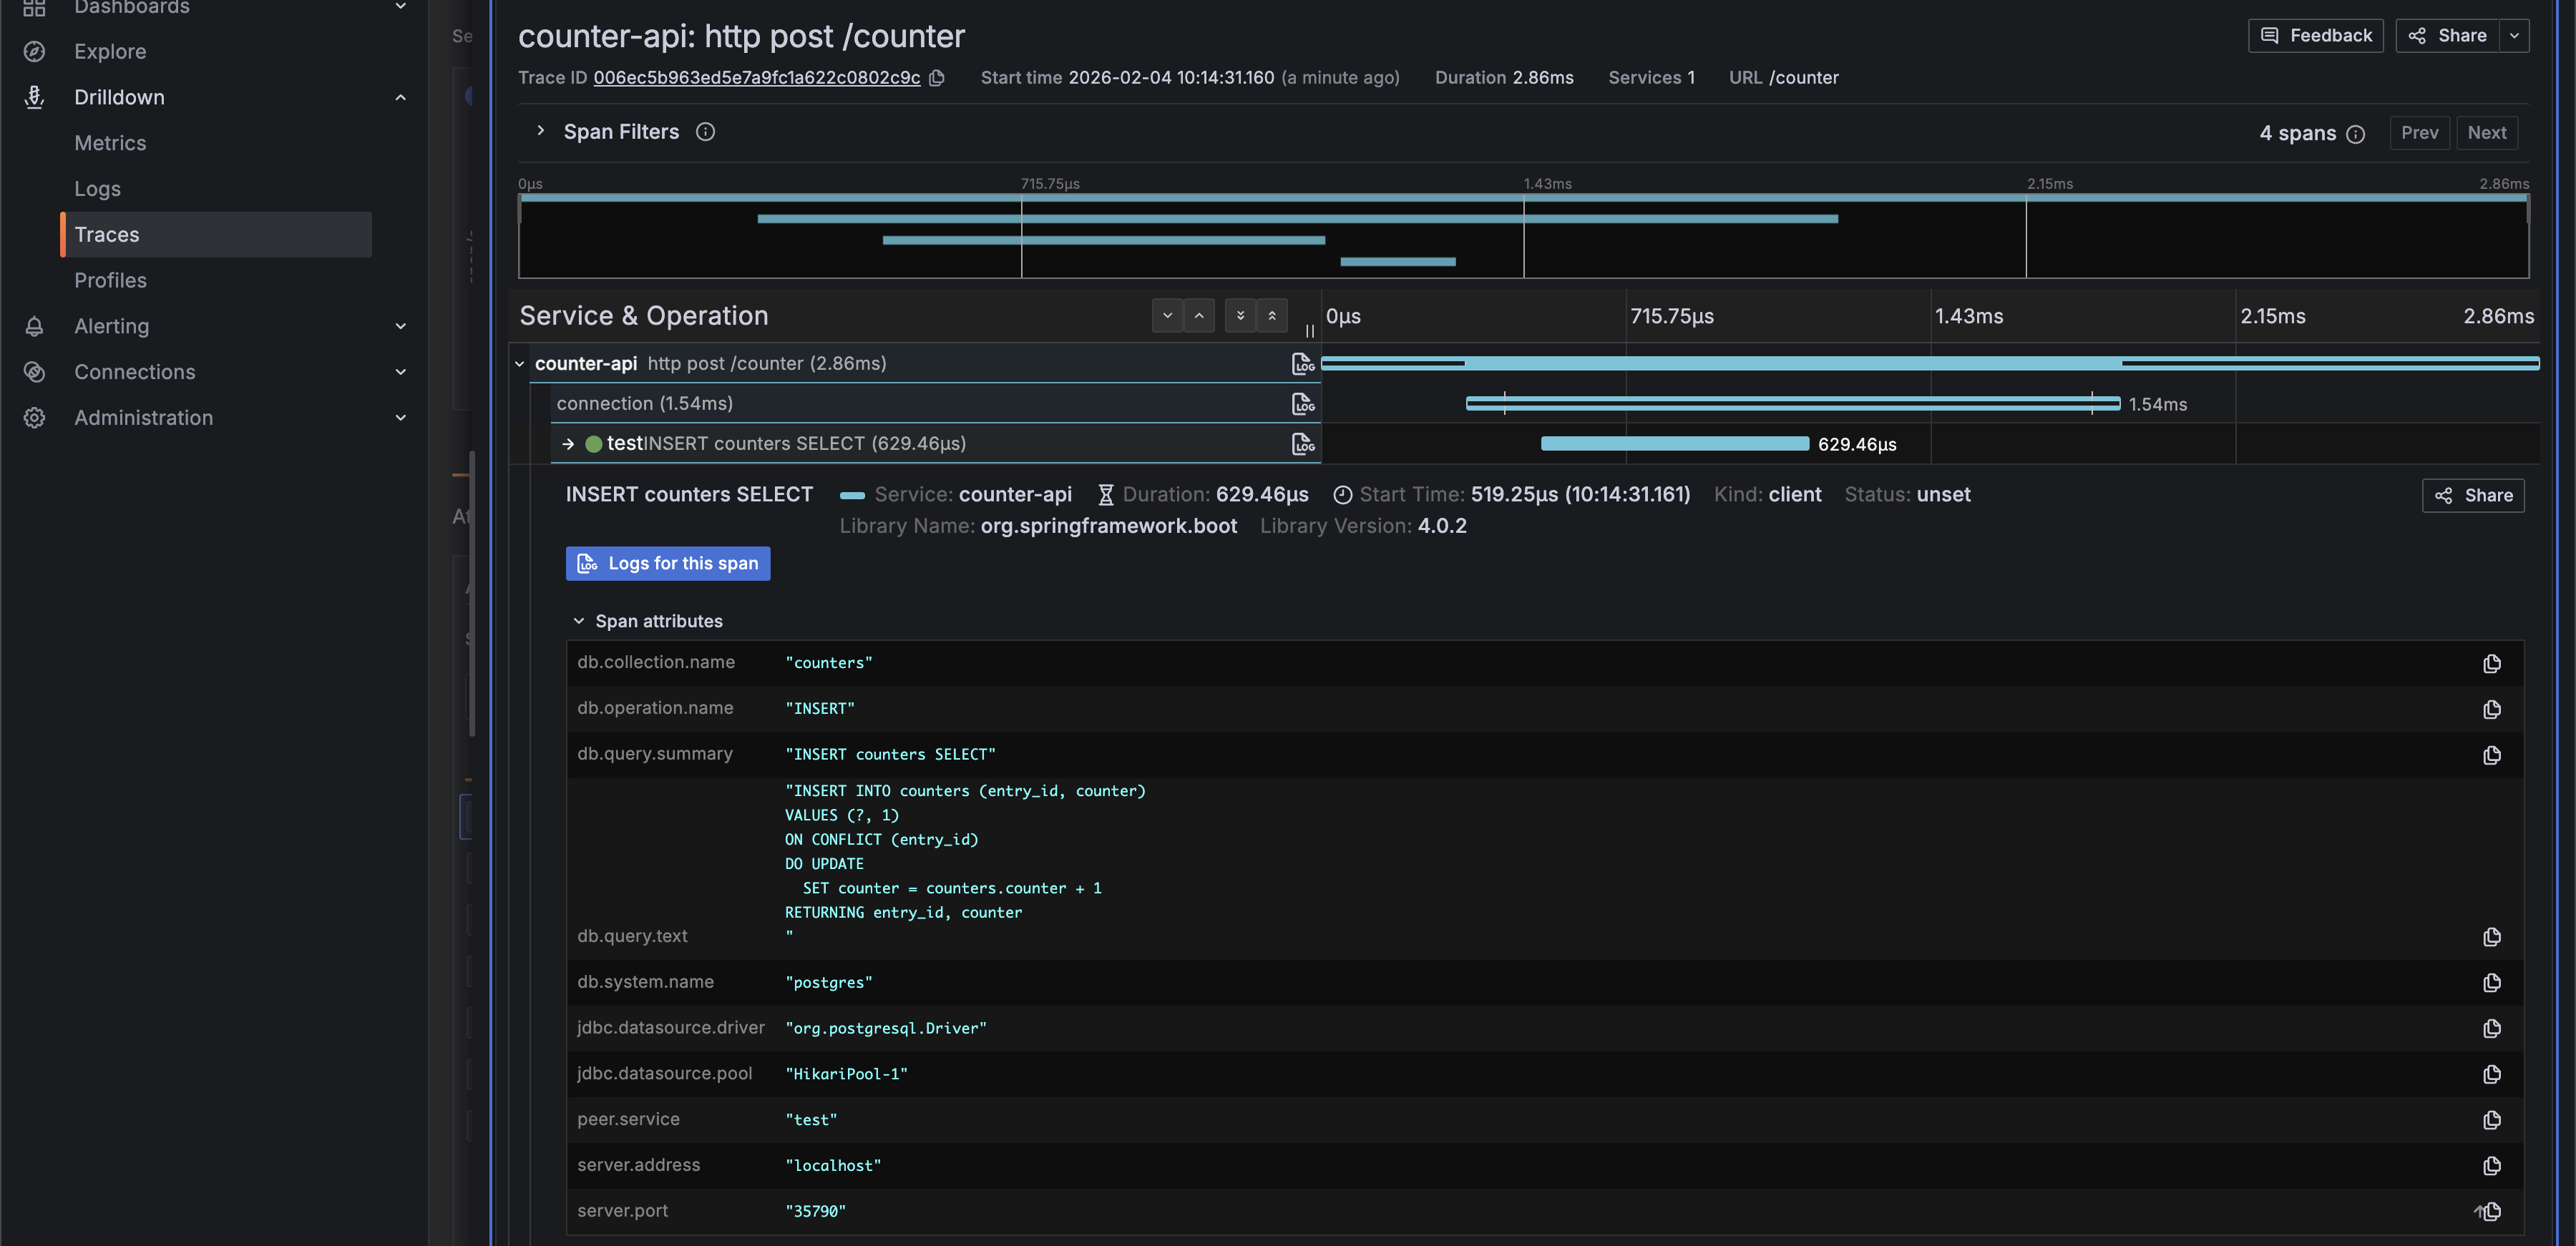
Because datasource-micrometer-opentelemetry is added, attribute names now follow the OpenTelemetry semantic conventions.
Click the "Log" button.
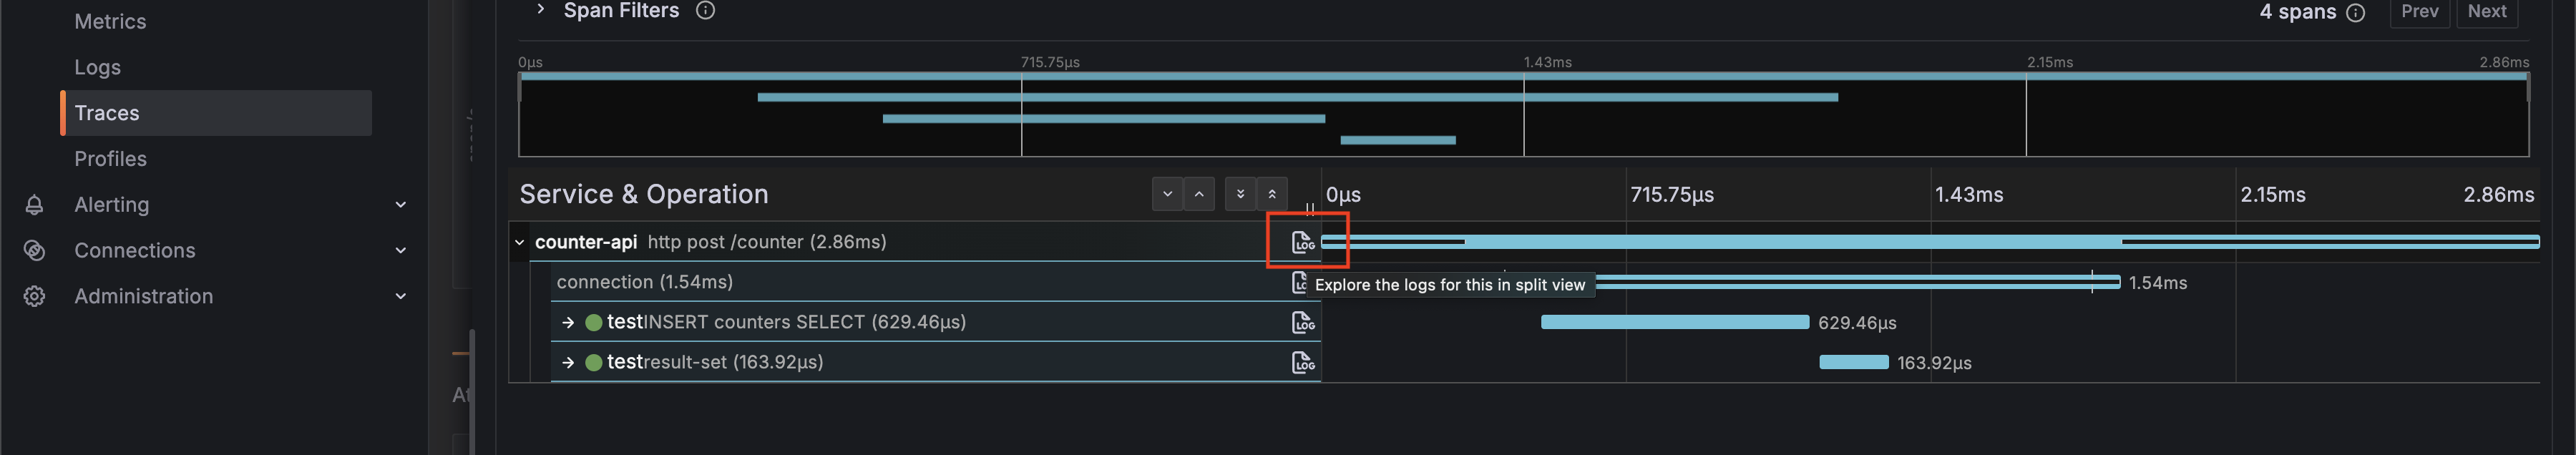
You can see the logs associated with this trace.
Metrics
Next, select "Metrics" from the left‑hand Drilldown menu. Choose "jdbc" in "Prefix filters" to restrict the view to metrics sent by Datasource Micrometer.
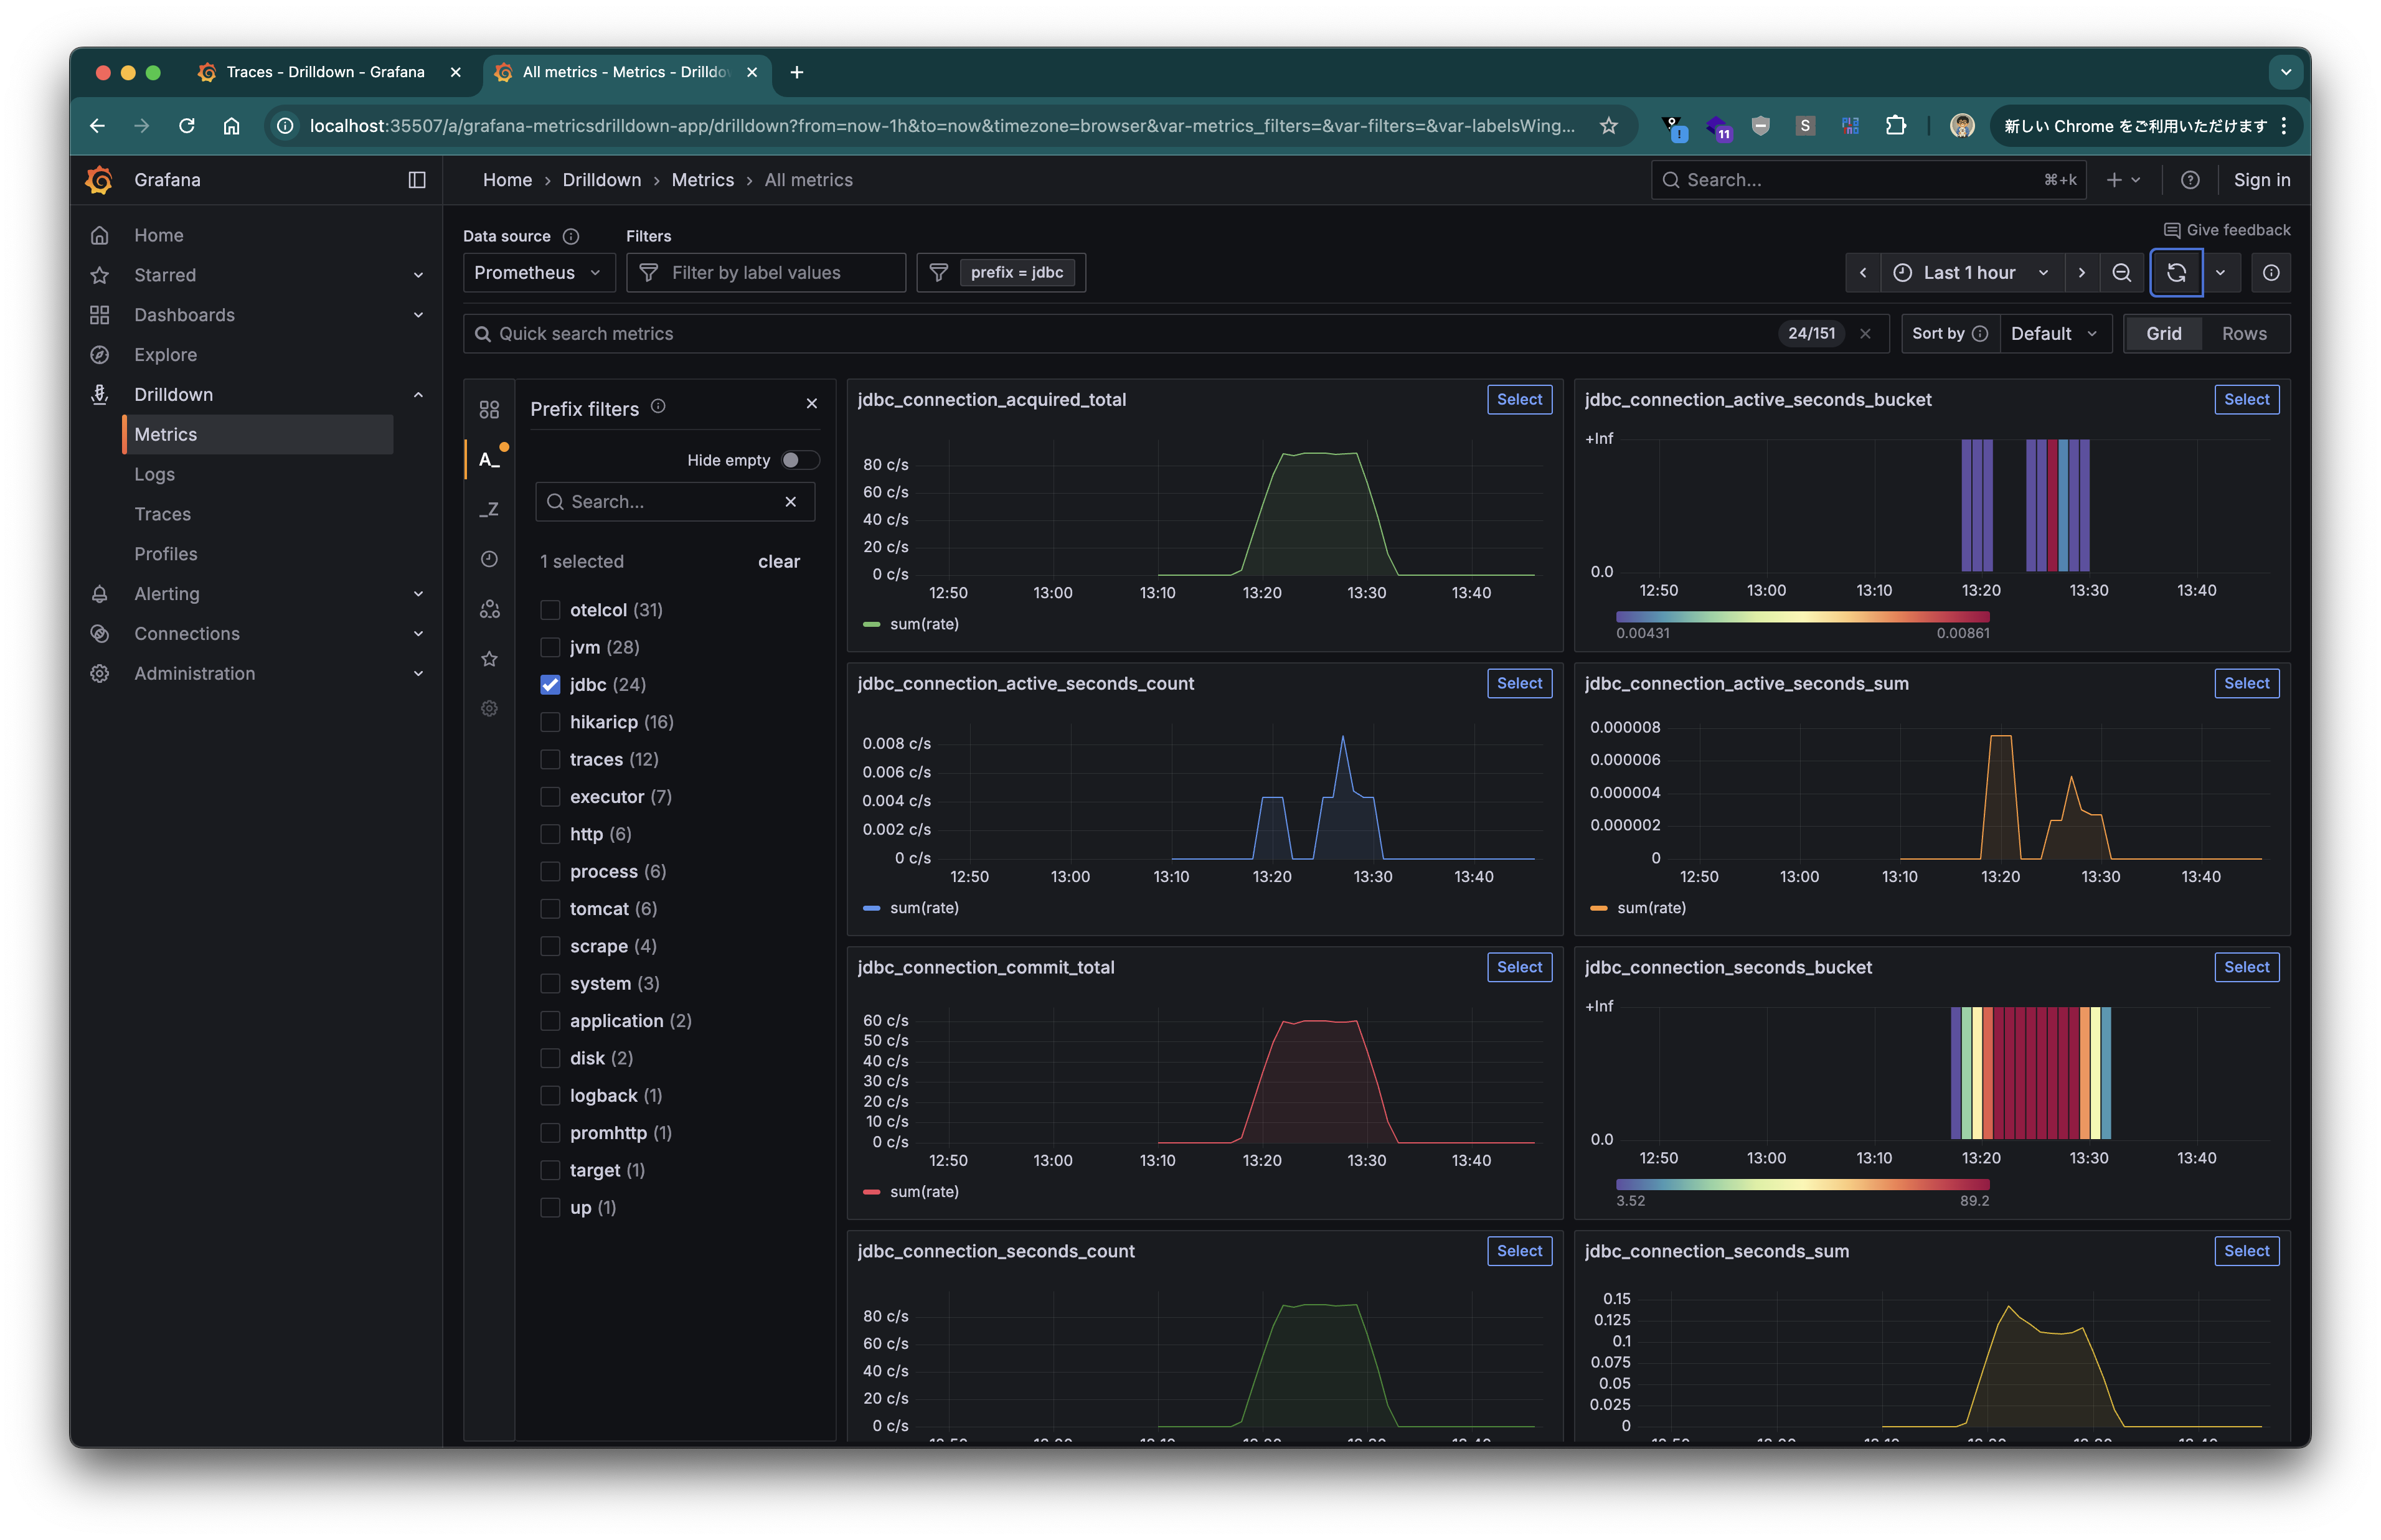
Refer to the documentation for the available metrics. You can obtain connection lifetimes, commit/rollback counts, query execution times, frequencies, and more.
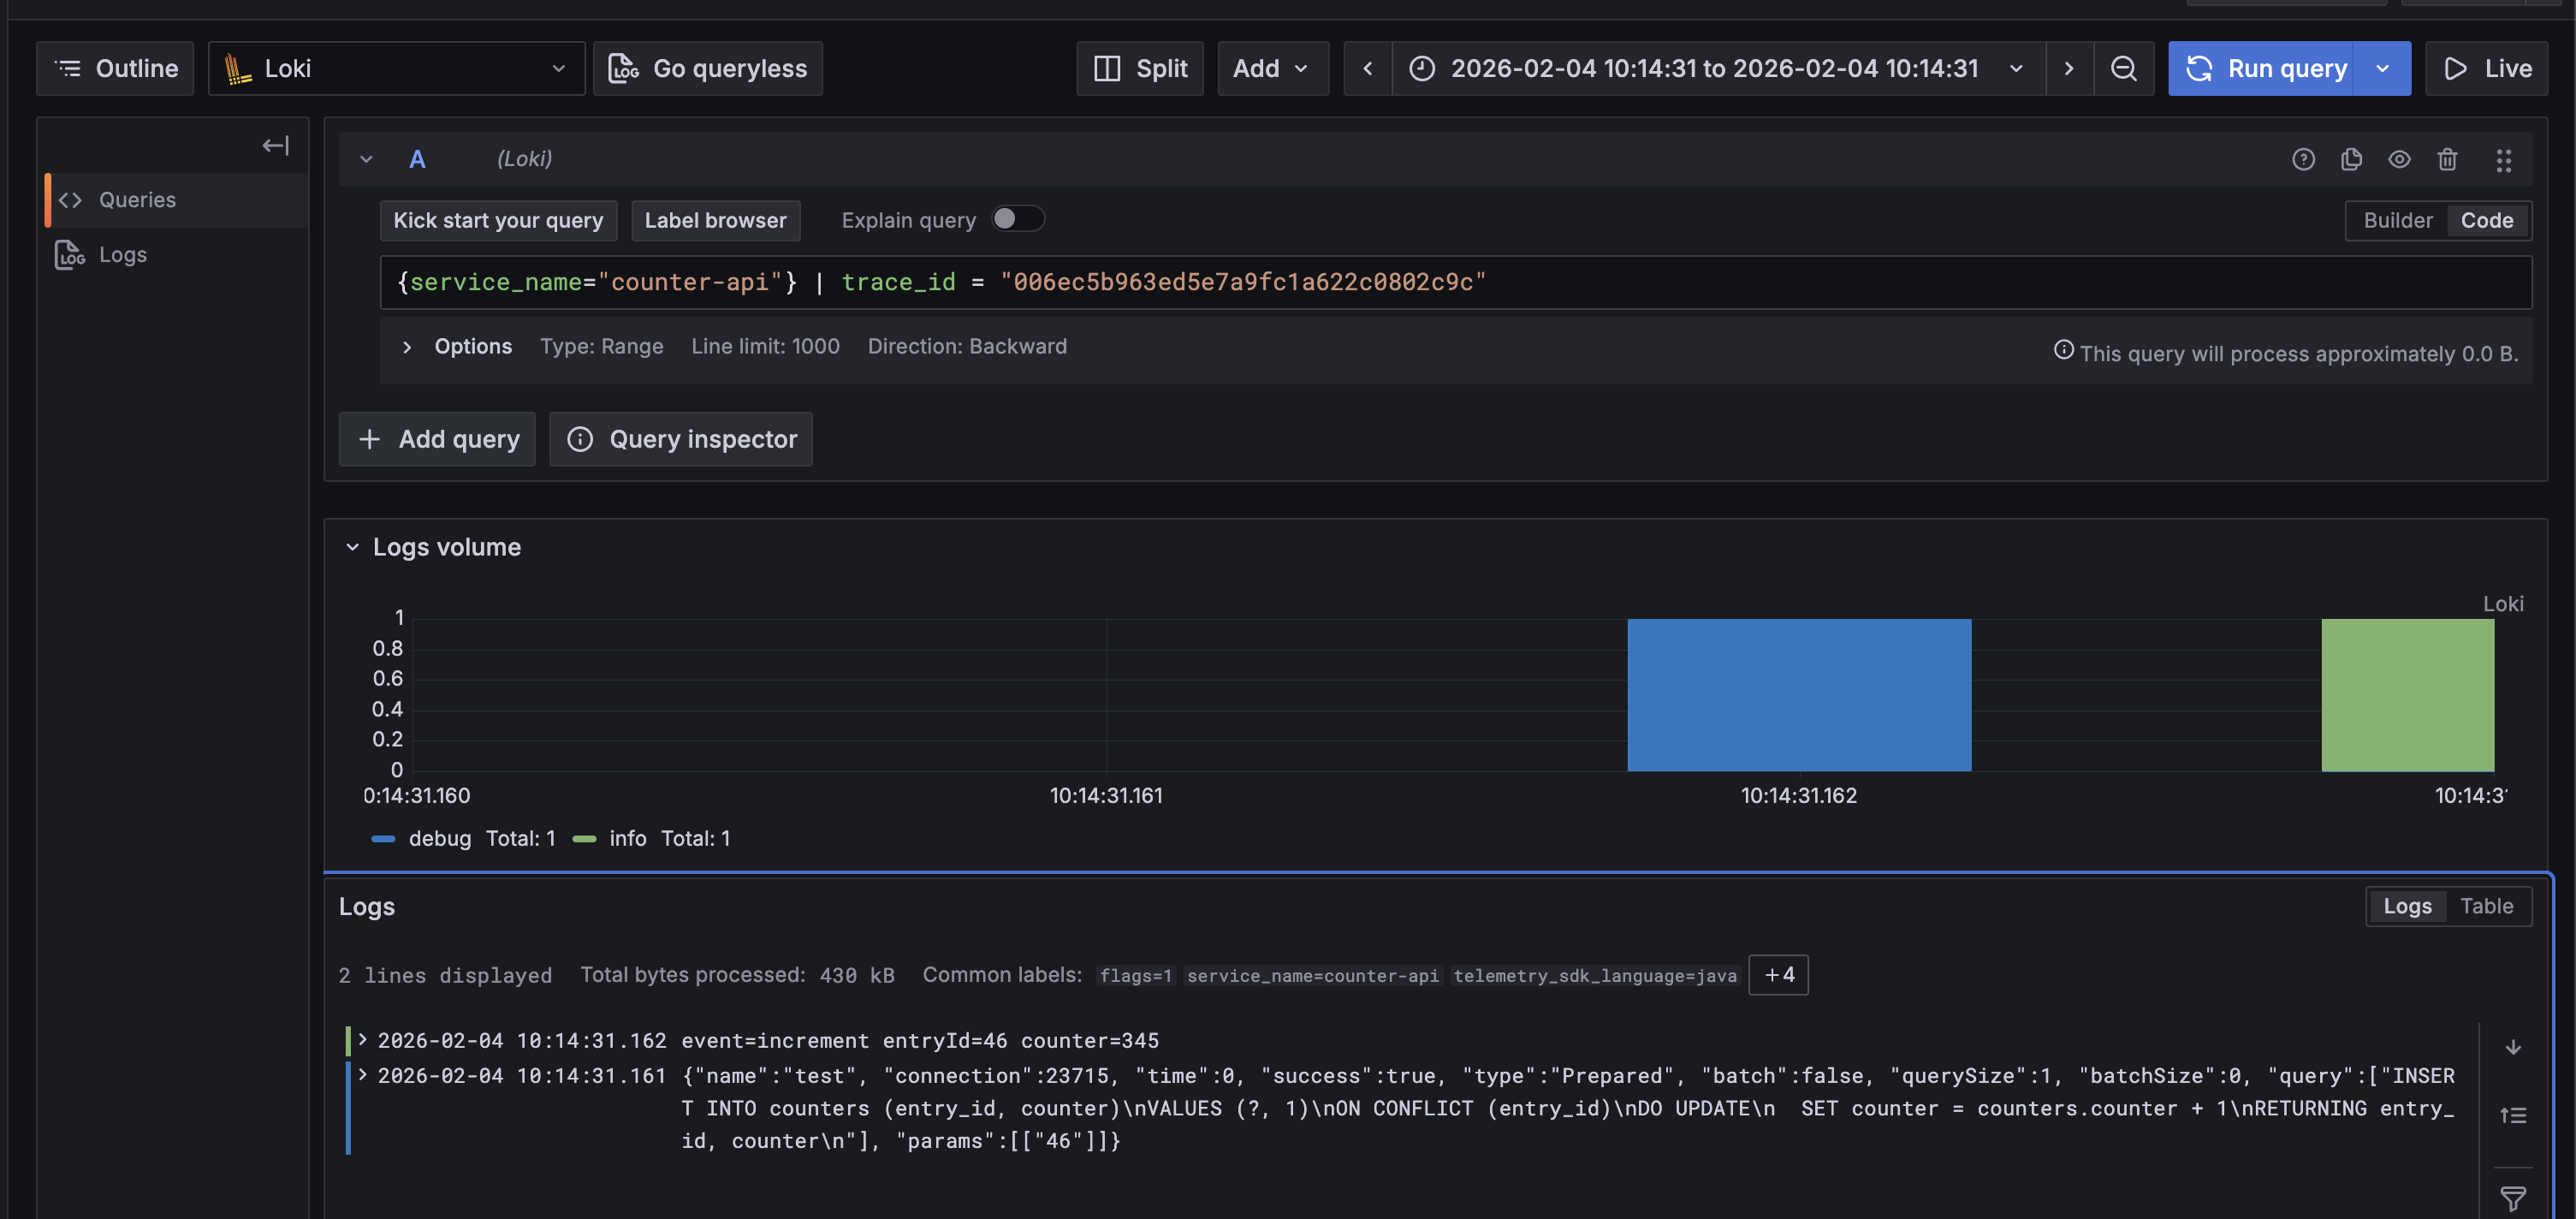
Logs
Finally, select "Logs" from the left‑hand Drilldown menu.
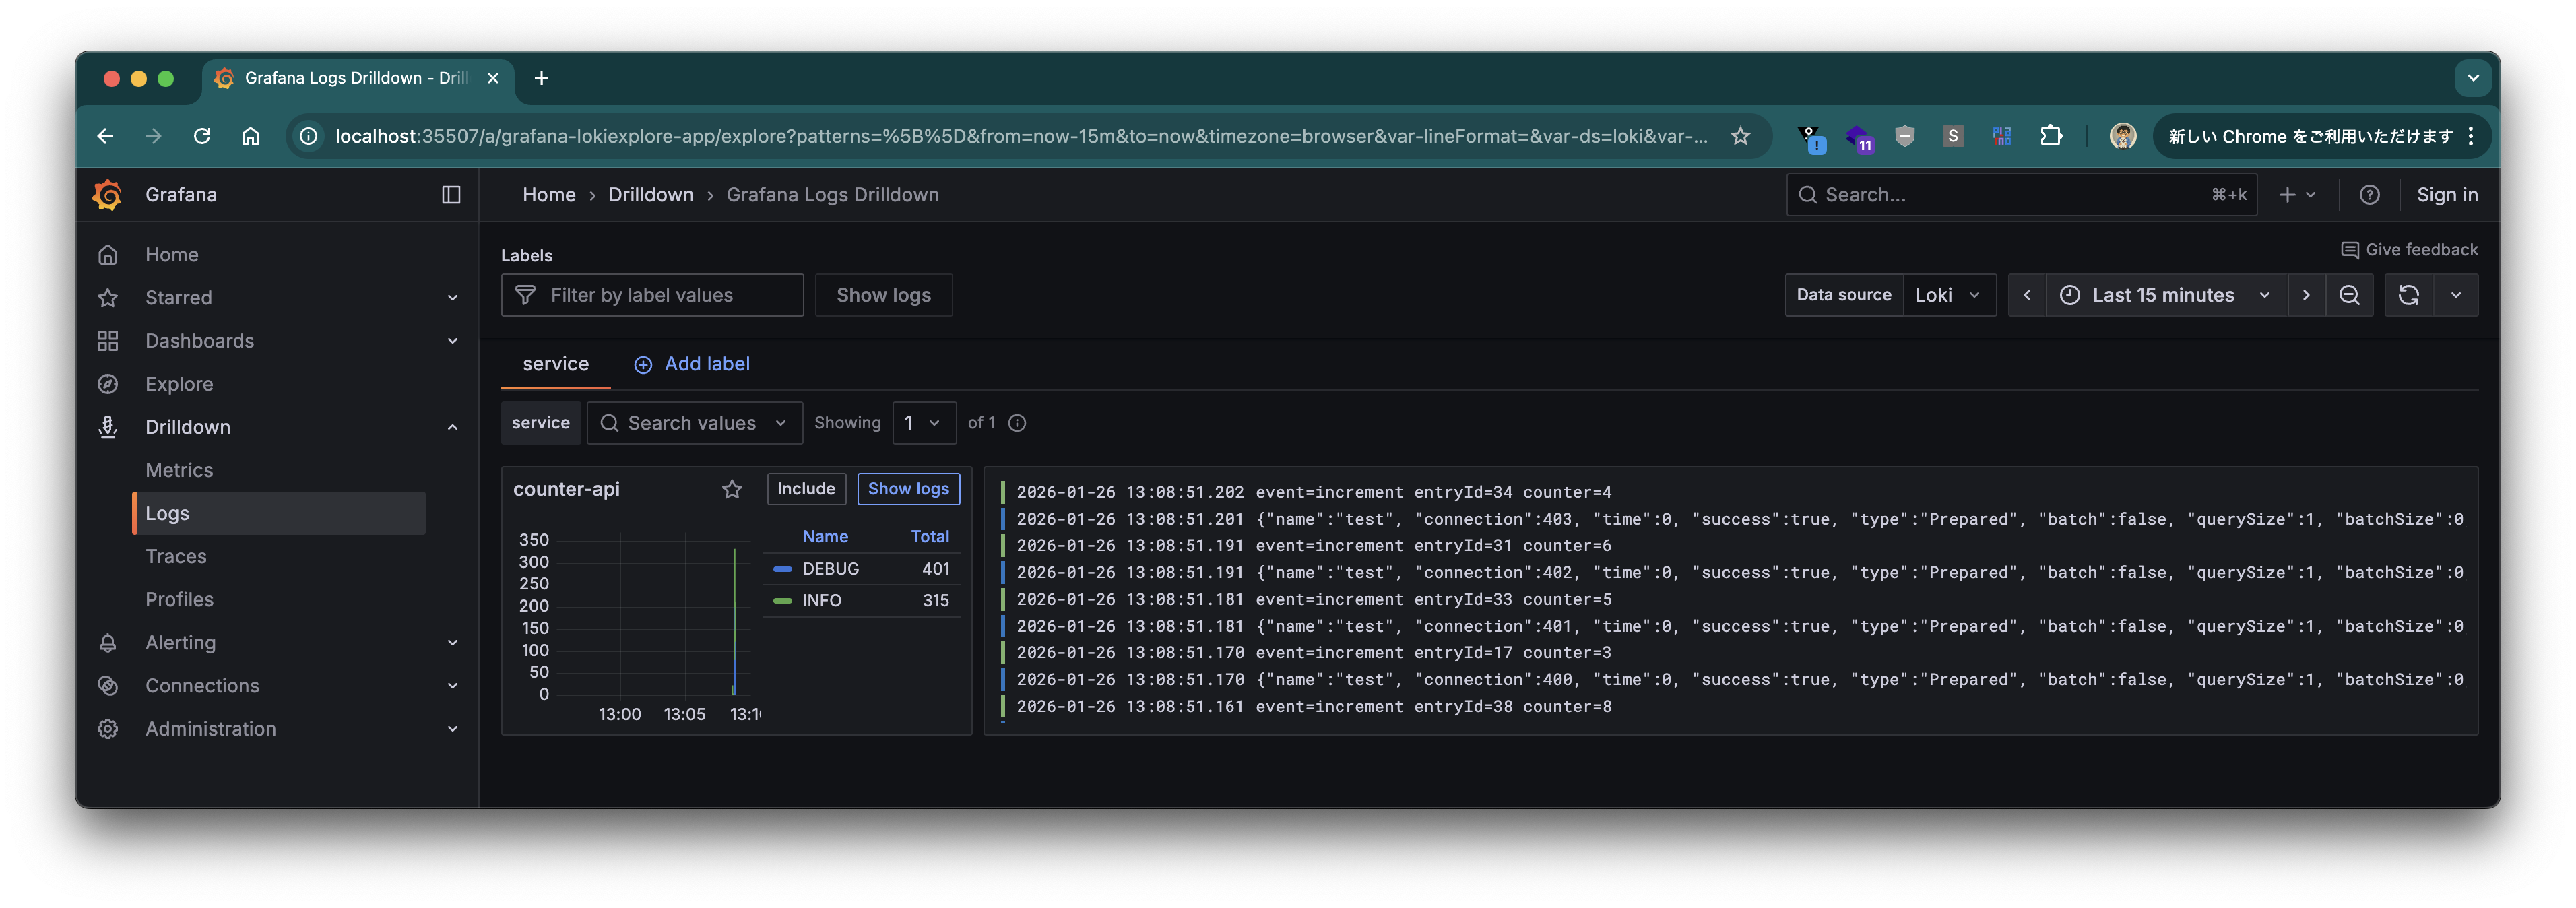
Click "Show logs" for "counter-api".
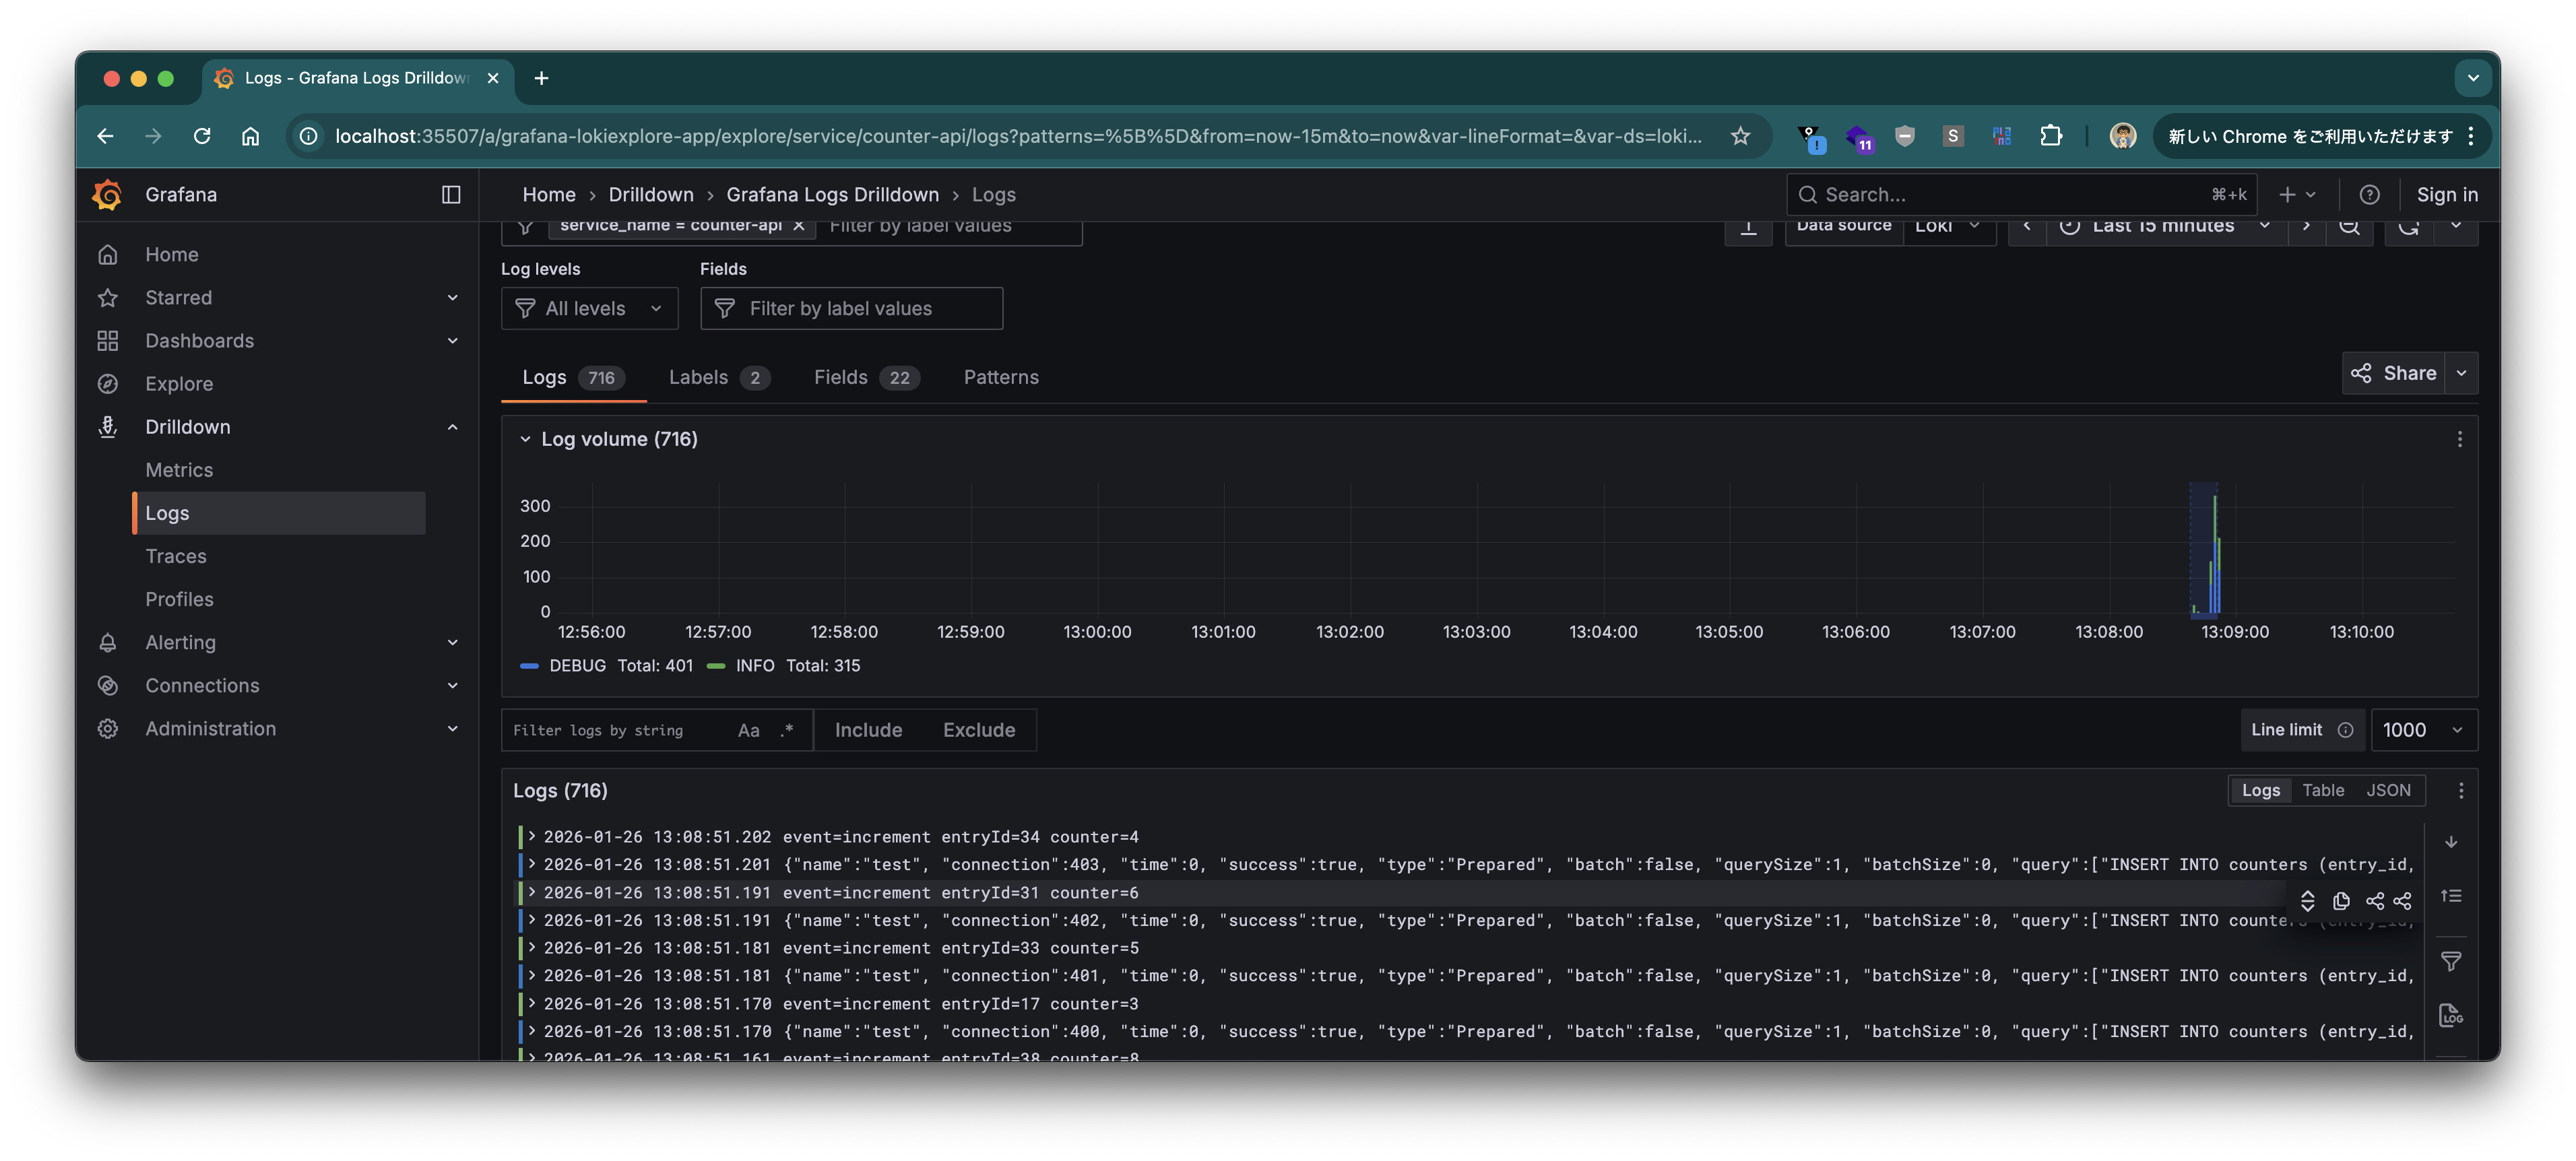
Click a specific log entry, then click the "Trace" button under "Links".
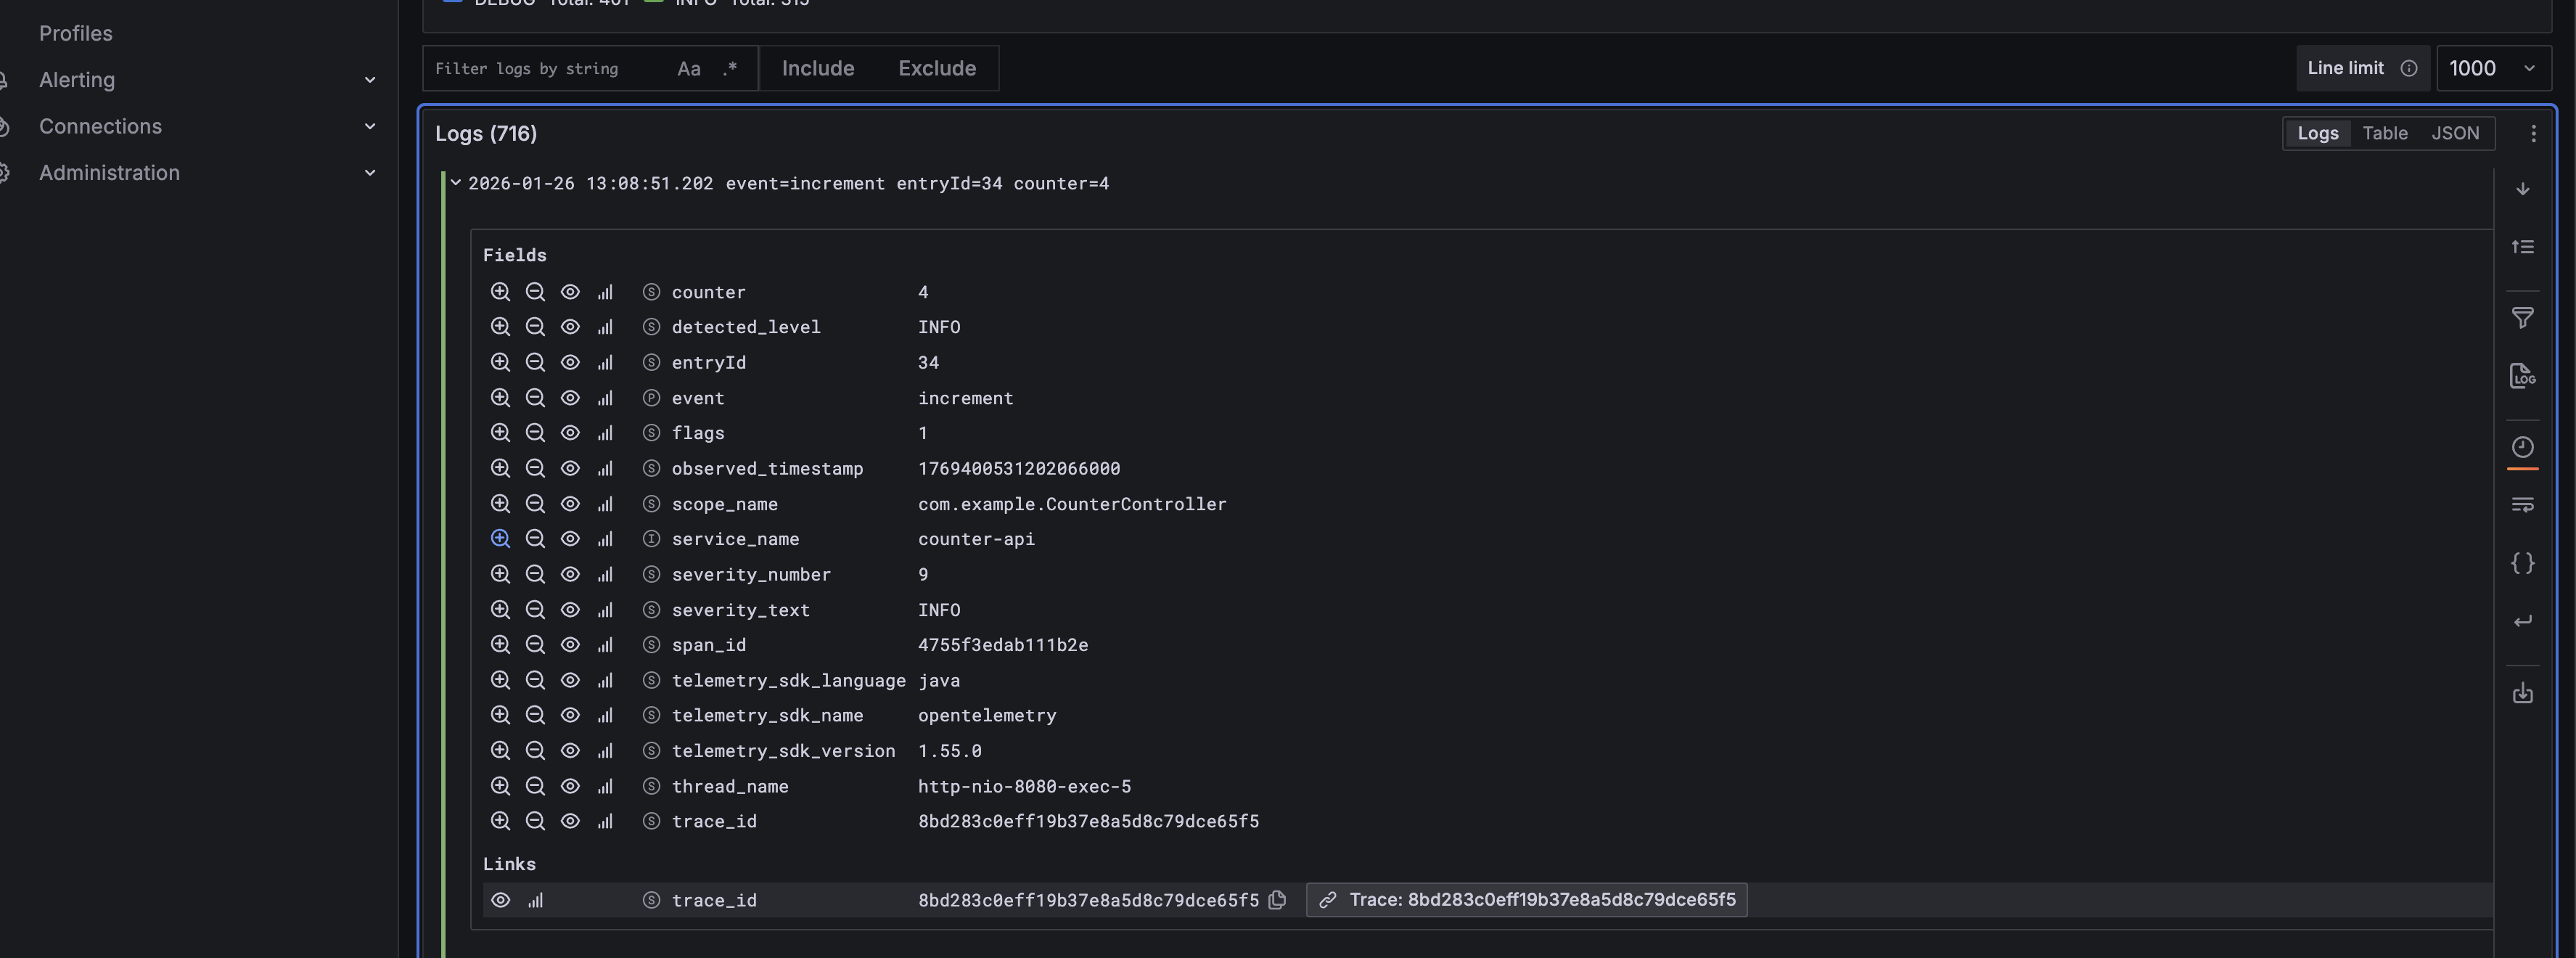
You’ll be taken to the Trace View, where you can also inspect the related SQL statements.
We have shown how to instrument JDBC operations in a Spring Boot application using Datasource Micrometer. Since it can be added directly from Spring Initializr, integration is straightforward. Give it a try!